Olson Technology CAN User Manual
Page 17
025-000570 Rev. X7
www.olsontech.com
17
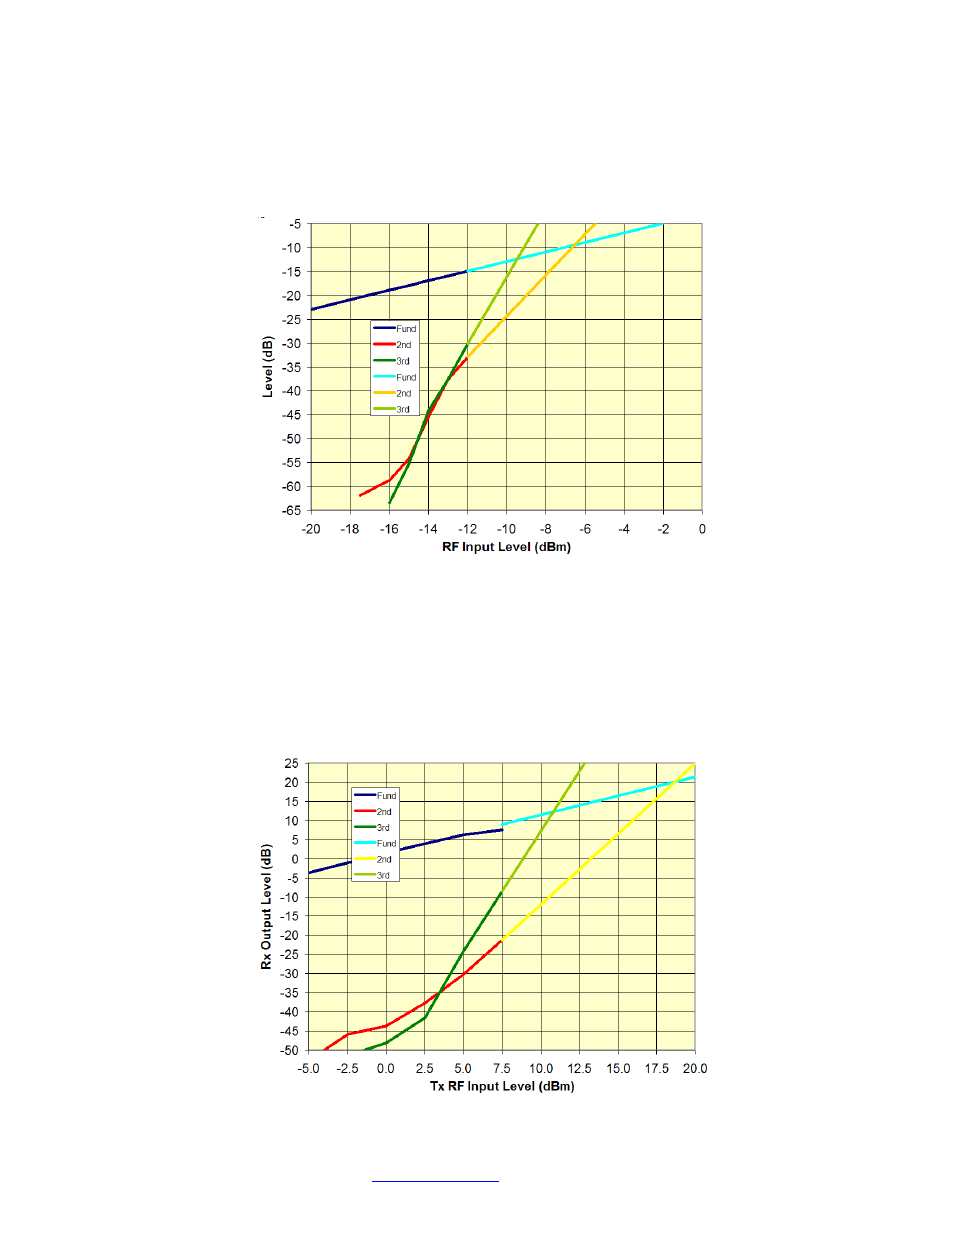
TRANSMITTER & RECEIVER IP2 & IP3 PERFORMANCE
Figure 15 shows the IP2 and IP3 performance of the transmitter. The test conditions were
with maximum transmitter gain, minimum Rx gain and 0dBm receiver optical input. The
dark blue, dark green and red lines are actual data. The light blue, light green and yellow
lines are extrapolated. Under these conditions, the IP2 is -6.5dBm and the IP3 is -9.5dBm.
Note that these will increase dB per dB as the transmitter gain is lowered.
Figure 15 - Transmitter IP2 & IP3 Behavior
Figure 16 shows the IP2 and IP3 performance of the receiver. The test conditions were with
minimum transmitter gain, maximum Rx gain and +3.5dBm receiver optical input. The dark
blue, dark green and red lines are actual data. The light blue, light green and yellow lines are
extrapolated. Under these conditions, the IP2 is +20dBm and the IP3 is +12dBm. (Note: These
values are read off of the vertical axis.) These will not change significantly as the receiver gain
changes.
Figure 16 - Receiver IP2 & IP3 Behavior