Chart, Hart – Super Systems e-TRIM User Manual
Page 14
Super Systems Inc. Page 14 of 27
e-TRIM Operations Manual
Chart
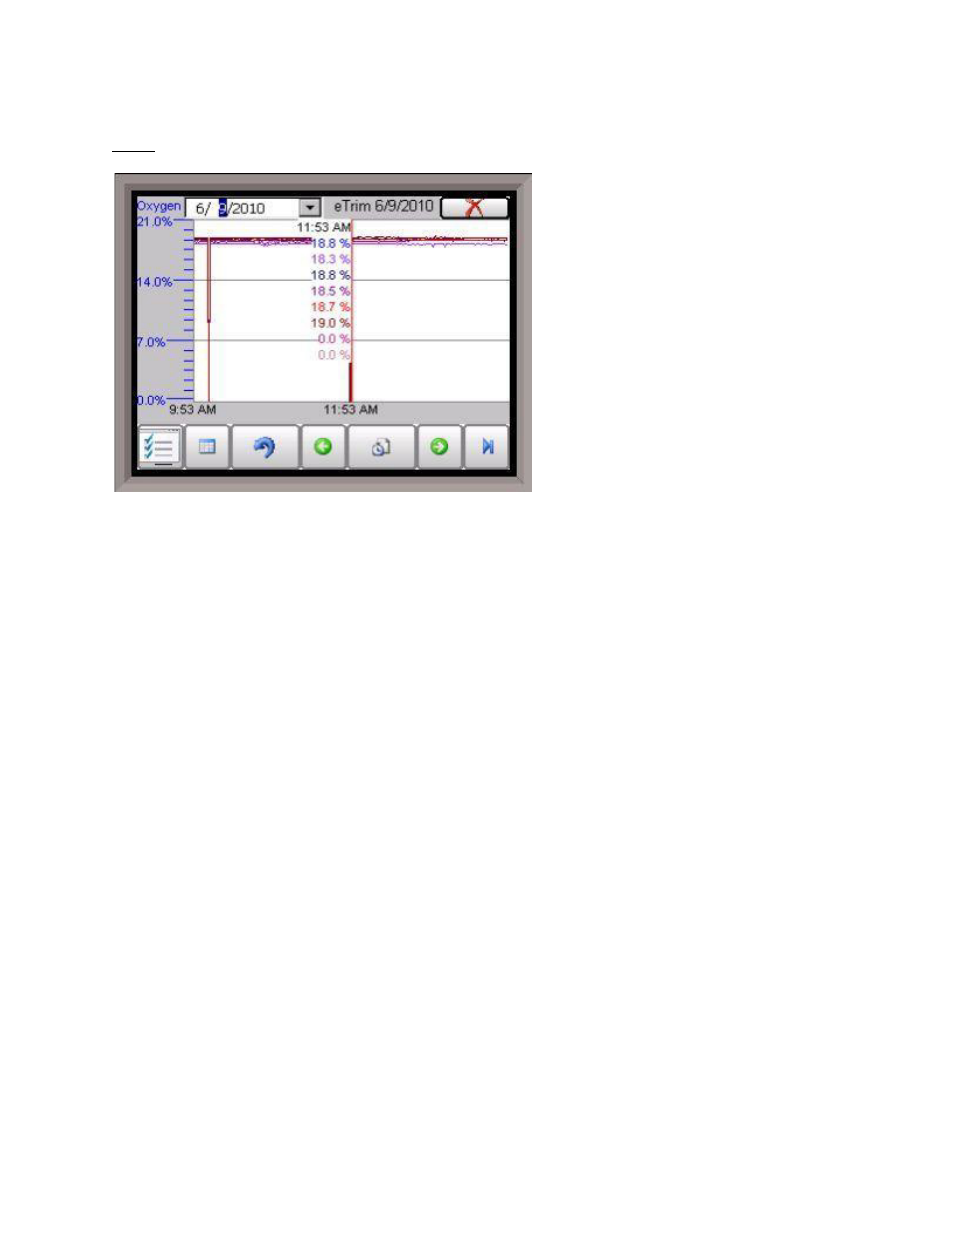
NOTE: This manual was written with oxygen readings from the ambient air, not in a valid run-
time environment.
This will display a chart of the data points for the e-TRIM system. Currently, the data points that
are logged are the Oxygen readings for up to sixteen burners. Each oxygen reading will be a
separate line and color on the graph.
The red line on the graph will act as a cursor. Holding down the stylus on the red line and
moving to the left or the right will modify the time on the bottom of the chart and update the
oxygen values displayed.
The red “X” in the top right corner will close the
Chart
screen.
The date for display can be changed by clicking on the down arrow next to the date in the top left
corner.
The beginning time for the display range will be listed in the bottom left corner of the chart. The
middle of the display range will be listed in the center of the chart. The chart will always use
the current system time as the starting point for the display range. If the range is 8 Hours, then
the time in the left corner of the chart will be 8 hours ago, and the time in the middle of the
chart will be 4 hours ago. If the range is 12 Hours, then the time in the left corner of the chart
will be 12 hours ago, and the time in the middle of the chart will be 6 hours ago.
If the user holds the stylus or their finger down on the white area of the chart for three (3)
seconds, a sub chart menu will be displayed.