Data logging and computer interface – Ion Science Hydrosteel 6000 User Manual
Page 23
Hydrosteel 6000 MANUAL
Ion Science Ltd
Page 23 of 39
Unrivalled Detection. www.ionscience.com
Data logging and computer interface
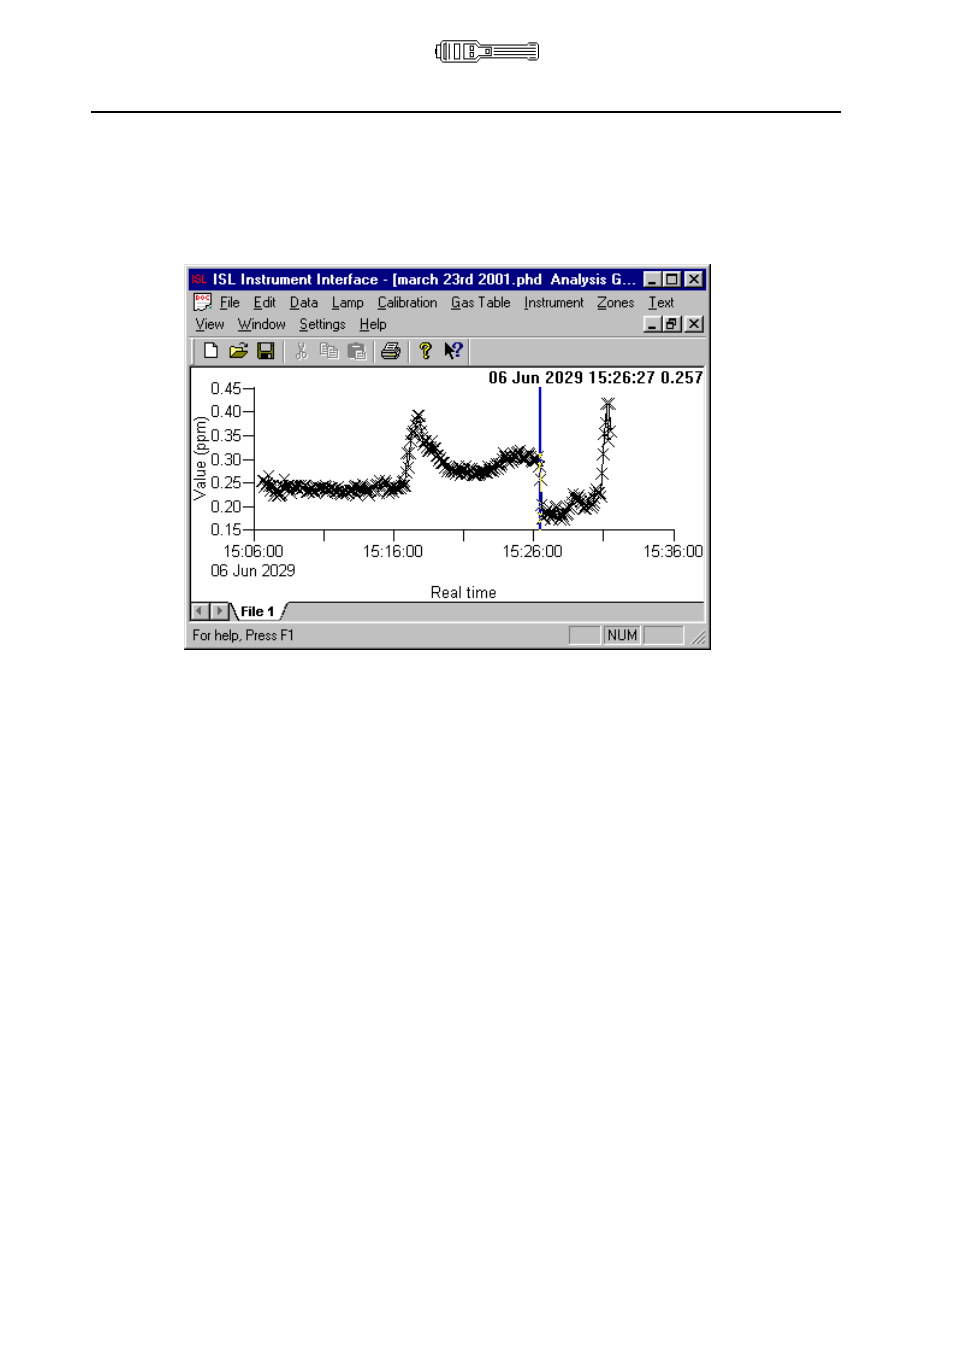
Graphical analysis of data
Setting the time and response scales
Choose Elapsed/Real time as required for time scale.
Choose Spread/Zero reference and Log/Linear scale required for the recorded response.
Using the cursor Right Click on the graphical analysis window to reveal the dropdown menu with the
following options:
Elapsed/Real time
No Markers
Cursor on/off
Log/Linear scale
Spread/Zero reference
Alarms on/off
Choose No Markers to remove all the crosses from the display.
Choose Cursor on and use mouse and a Left Click to position the cursor on the Graph. The data
(x,y) will be shown top right.