Absolute maximum ratings, Typical performance graphs – Linx Technologies HUM-xxx-RC User Manual
Page 6
– –
– –
6
7
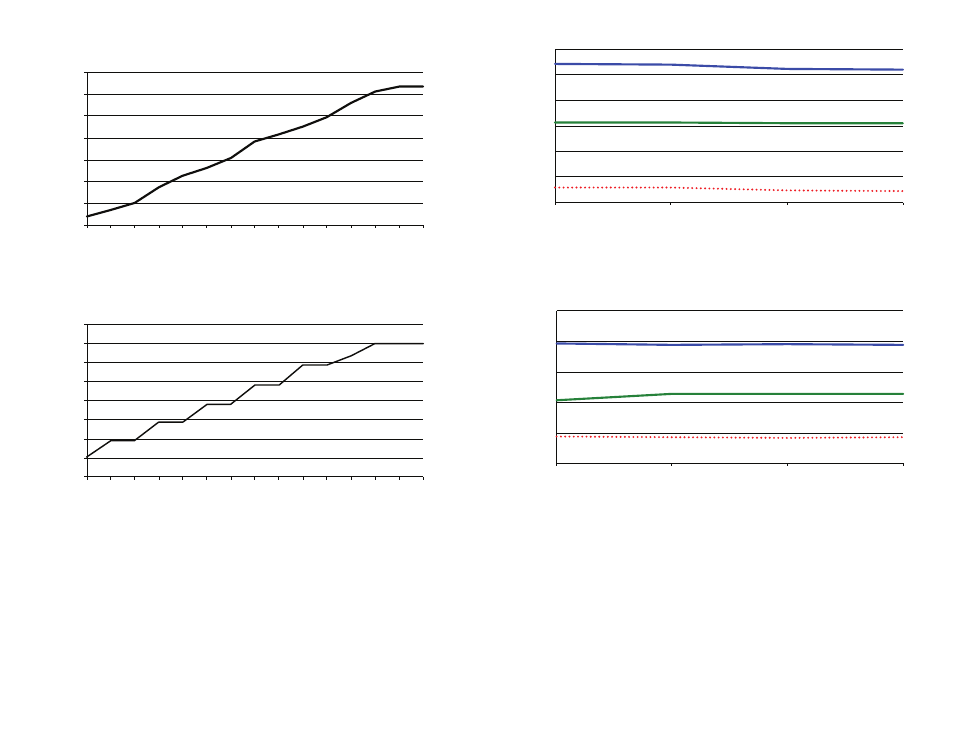
Typical Performance Graphs
-30.00
-25.00
-20.00
-15.00
-10.00
-5.00
0.00
5.00
0.00 0.25 0.50 0.75 1.00 1.25 1.50 1.75 2.00 2.25 2.50 2.75 3.00 3.25 3.30
TX Output Power (dBm)
LVL_ADJ Voltage (V)
Figure 6: HumRC
TM
Series Transceiver Output Power vs. LVL_ADJ Resistance - HUM-2.4-RC
-25.00
-20.00
-15.00
-10.00
-5.00
0.00
5.00
10.00
15.00
0.00 0.08 0.15 0.23 0.30 0.38 0.45 0.53 0.61 0.68 0.76 0.83 0.91 0.98 1.00
TX Output Power (dBm)
LVL_ADJ Voltage (V)
Figure 7: HumRC
TM
Series Transceiver Output Power vs. LVL_ADJ Resistance - HUM-900-RC
Figure 9: HumRC
TM
Series Transceiver Max Output Power vs. Supply Voltage - HUM-900-RC
8.5
9.0
9.5
10.0
10.5
11.0
2.0
2.5
3.3
3.6
TX Output Power (dBm)
Supply Voltage (V)
85°C
25°C
-40°C
-1.0
0.0
1.0
2.0
3.0
4.0
5.0
2.0
2.5
3.3
3.6
Transmitter Output Power (dBm)
Supply Voltage (V)
85°C
25°C
-40°C
Figure 8: HumRC
TM
Series Transceiver Max Output Power vs. Supply Voltage - HUM-2.4-RC