CIRCUTOR PowerStudio Series User Manual
Page 55
PowerStudio
User Manual 55
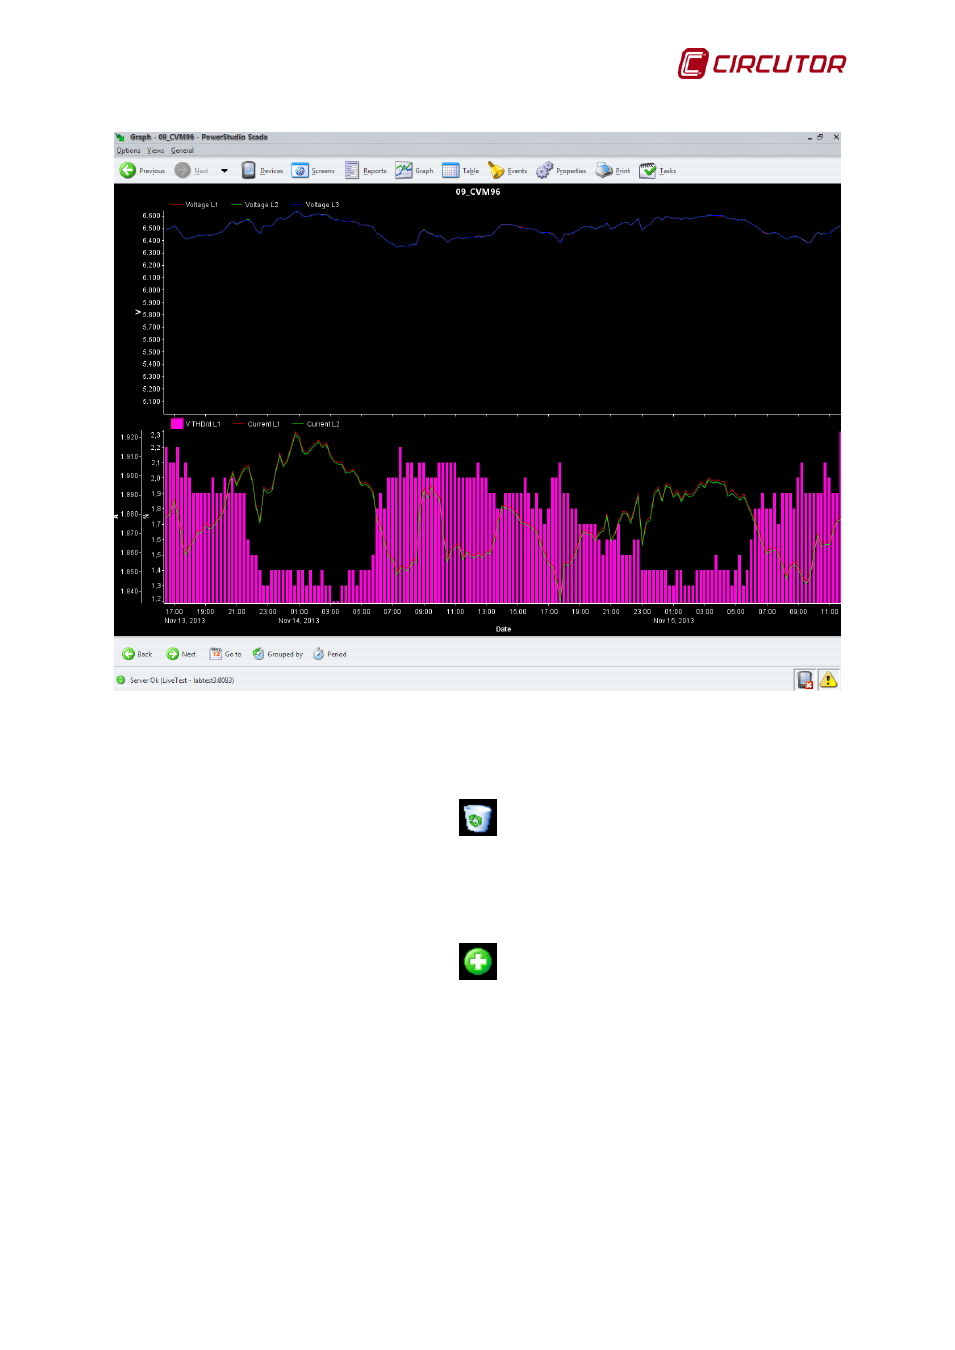
Graph where the interior limit of a Y-axis has been forced
Finally, the only configuration of an area that may be changed is its position. So, like variables
and axes, a zone can be dragged to another position, but only within another area, "outside" or to the
trash (deleting all axes and variables that it contains).
Trash
One of the most interesting possibilities offered by the property screen is that of adding new
variables to the chart. This is done by clicking on the button with the “+” sign, which is located on the
lower left.
Add new variables to the graph
Equipment and variable selection windows will appear, allowing other variables to be added,
including those from a different device. In the example a phase 1 voltage variable from other
equipment has been added.