CIRCUTOR PowerStudio Series User Manual
Page 90
PowerStudio
90 User Manual
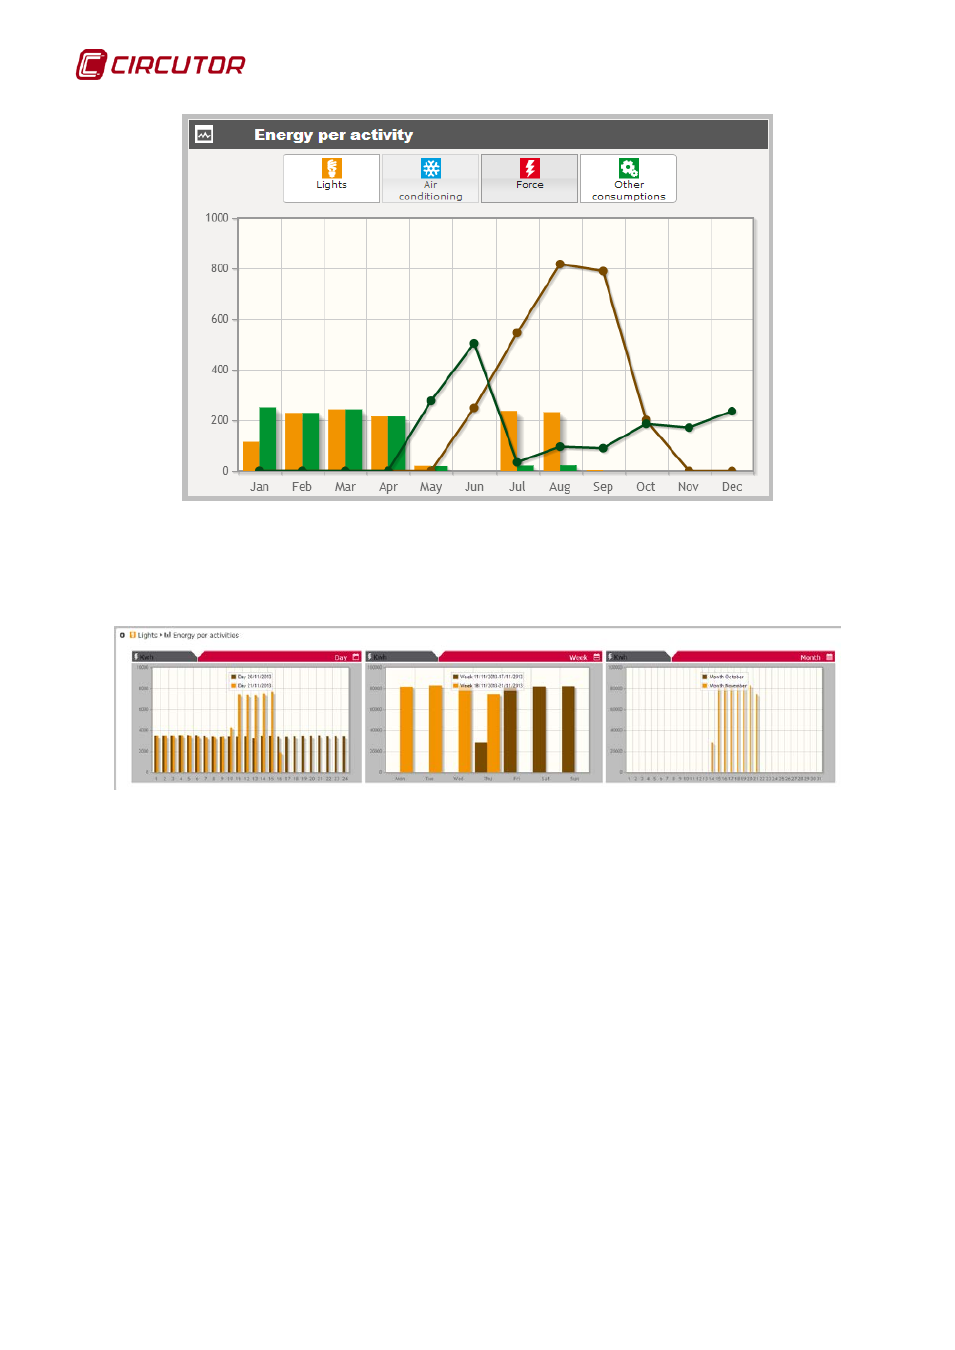
Main graphic that only shows the ‘Lighting’ and ‘Other consumption’ variables
Finally, more detailed information about the comparison of data of the same variable can be
shown by clicking on the drop-down menus on the bottom of the widget. The following view shows a
daily comparison of the times between the last and current dates, a weekly comparison by date,
between the last and current weeks and a monthly comparison between the last and current months.
‘Lighting’ variable in detail
The ‘Update’ button can be clicked on the top left of the widget to refresh the data of all
variables, so that the latest data is downloaded. In addition, the widget will be automatically updated on
a regular basis; the last update time will be shown on the top right of the application.
Note: A 1920x1080p resolution is recommended for an optimum view of this widget.