Main screen, Channel controls, Main screen 3.3. channel controls – Dataman 520 Series User Manual
Page 12: Fig. 3.2.1. – main screen
Spectrum analyzer
User’s guide
3.2. Main screen
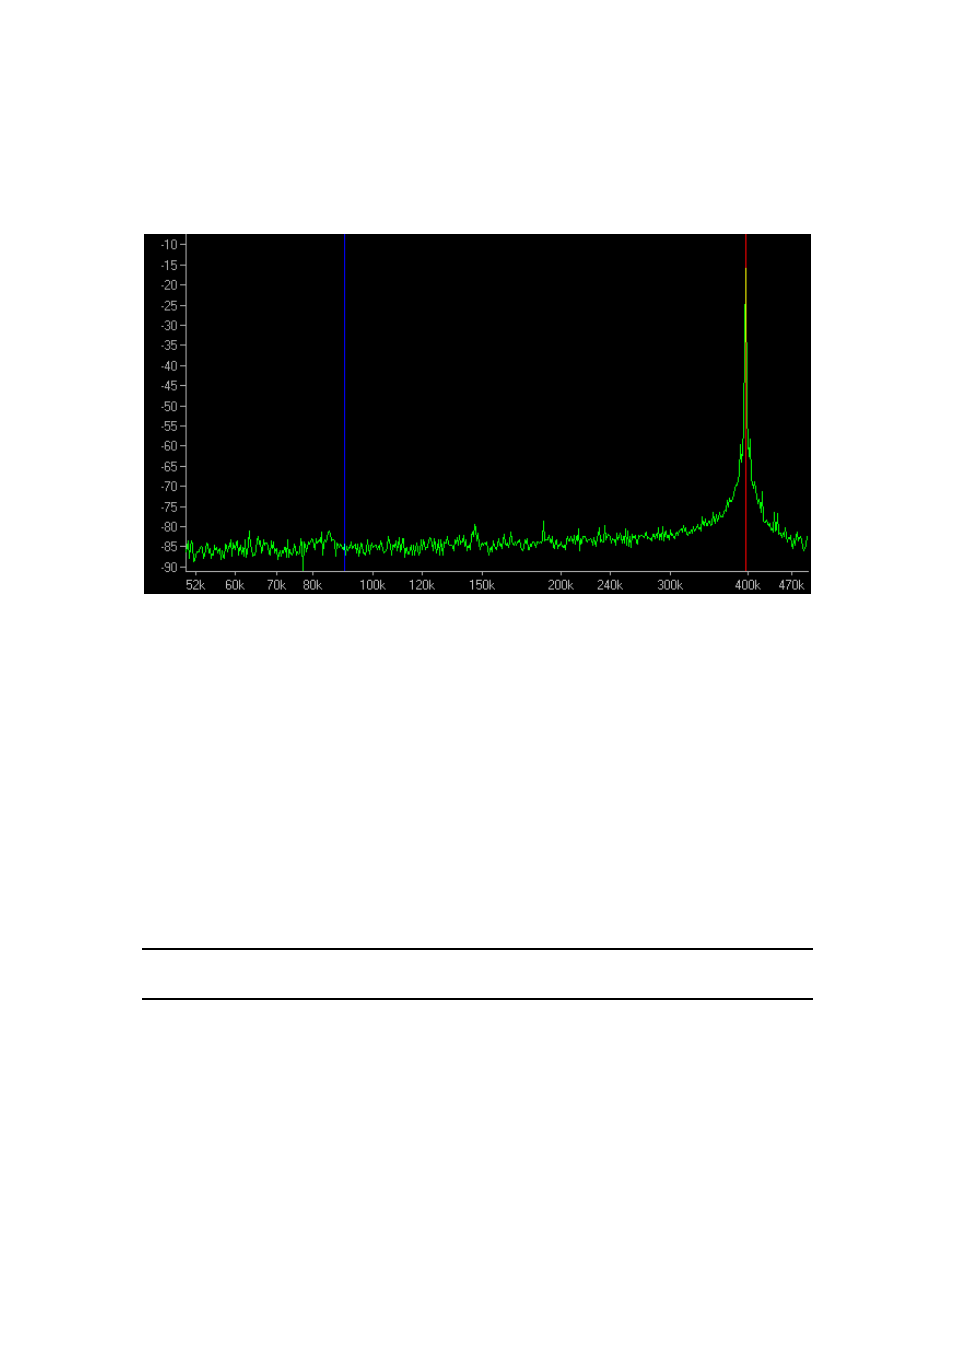
The main screen is located in the middle of the main window. This screen is used to
display the spectrum.
Fig. 3.2.1. – Main screen
Spectrum is displayed in the channel color. Both X and Y axis are logarithmic.
Vertical range is adjustable as follows:
- drag top third of the vertical legend to set maximal displayed value
- drag middle of the vertical legend to move waveform vertically (range will remain
intact)
- drag bottom third of the vertical legend to set minimal displayed value
The displayed spectrum part can be set using the navigator or dragging the waveform
on the screen.
You can zoom data in two ways:
- either click on the “Zoom in” or “Zoom out” button
- or set mouse pointer on the screen and spin the mouse wheel
TIP: Spin the mouse wheel on the screen to perform zoom. The frequency below
the mouse pointer remain on the same position (if possible).
Two vertical and two horizontal cursors are available. In case they are out of the
screen, the arrow in the cursor color appears on the side of the screen. Drag this arrow
to move cursor back onto the screen.
3.3. Channel controls
The channel controls are located in the left of the main window.
- 12 -