Exacq exacqVision Virtual User Manual User Manual
Page 11
www.e
x
acq.com
+1.317.845.5710
+44.1438.310163
USA (Corporate Headquarters)
Europe/Middle East/Asia
Page 11 of 44
4/12/2013
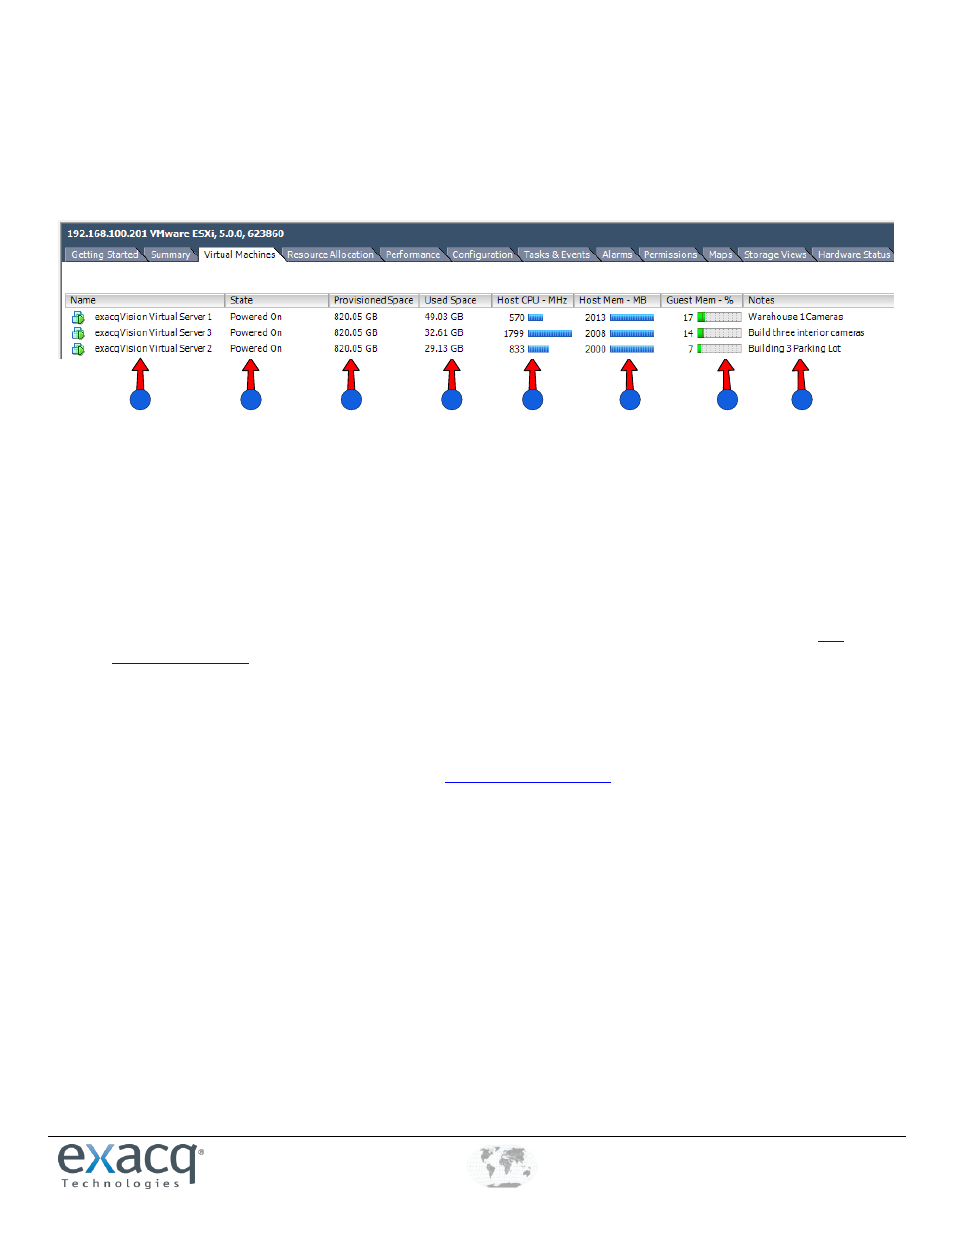
Virtual Machine
Because the exacqVision Virtual server is a virtual machine and shares server host hardware, performance issues can be identified
using the VMware client. To do this, start your client and open up the Host and Clusters view. From the Inventory pane, click on the
server host the exacqVision Virtual Server is running on and click the Virtual machines tab. This screen can quickly provide the
following information about the state of your servers:
2
1
3
4
5
6
7
8
1. Name. For better organization, match your server name with the name of server in your exacqVision Client.
2. State. Verify that server is powered on. If it is not, right-click the VM and select Power On.
3. Provisioned Space. View the amount of space is allocated to the VM. If recording history is too short, additional virtual disk
might need to be added (see Section 10).
4. Used Space. View how much of the allocated space is in use.
5. Host CPU – MHz. View how much of the CPU resources your virtual machine is consuming from the host. The default CPU
reservation is 2000 MHz; if this value is close to 2000, increase your virtual machine’s CPU count or reservation
6. Host Mem – MB. This is the actual value of memory being allocated to the server. This number indicates the memory
reservation and host memory overhead.
7. Guest Mem – %. The bar graph shows the percentage of memory in use. If this is consistently 80% or higher, consider
allocating additional memory to the virtual machine
8. Notes. Add descriptive information about each virtual machine by editing Annotations, found under the Summary tab of
the virtual machine.
Additional virtual machine performance monitoring information can be found in
section 11.