Fronius Personal Display DL User Manual
Page 69
67
EN-US
Display values for
individual invert-
ers in the 'Day /
Year / Total' dis-
play modes
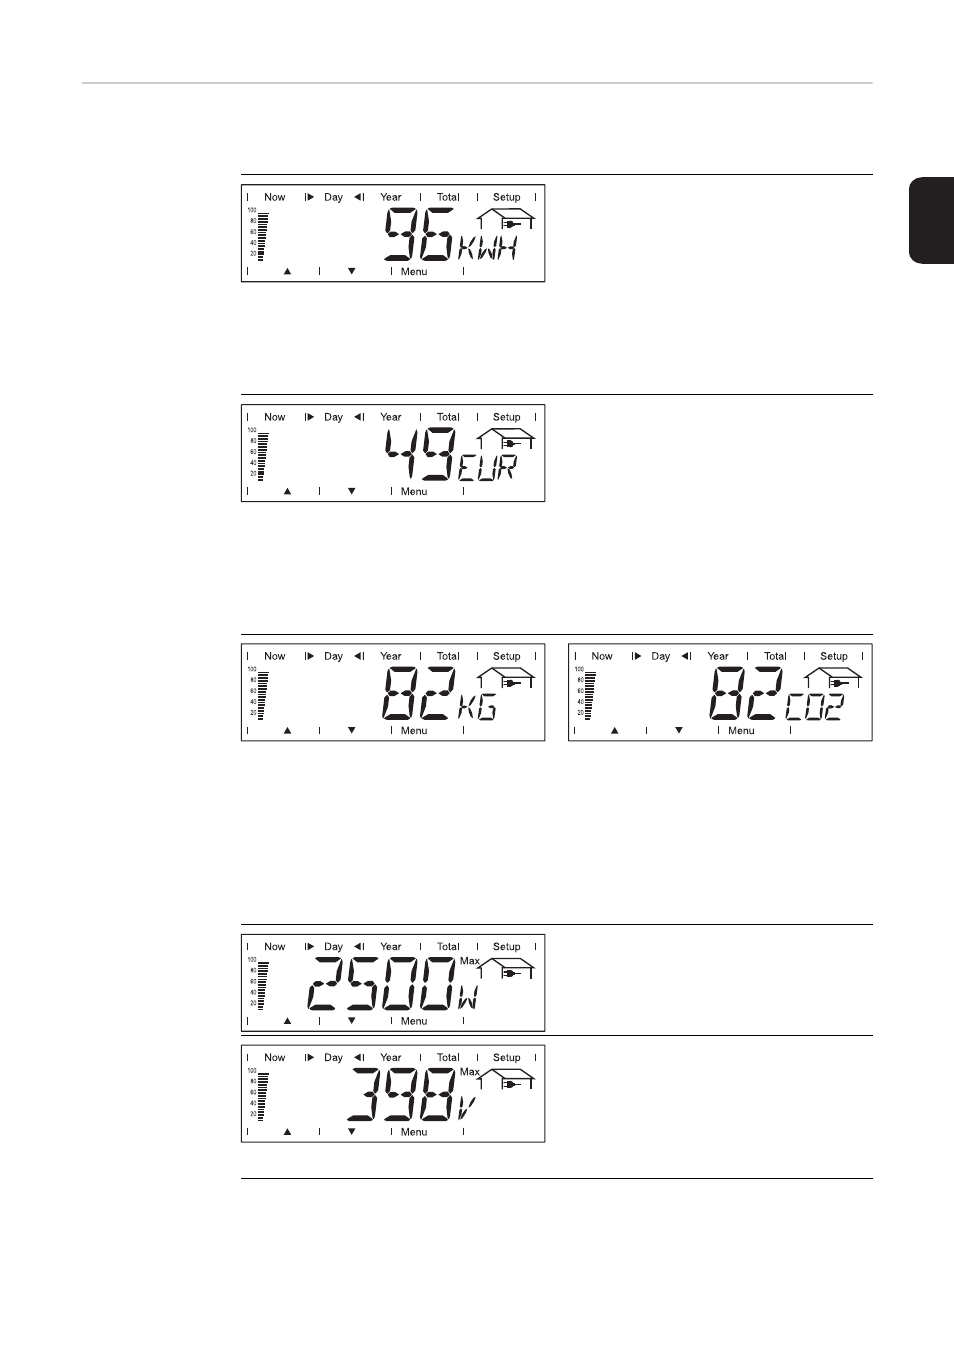
The Fronius Personal Display DL can show the following power data in the 'Day,' 'Year' and
'Total' display modes for an individual inverter in the system:
Output energy
Energy fed into the grid over the period of
time in question (kWh / MWh)
Due to the variety of different monitoring systems, there can be deviations between the
readings of other metering instruments and the readings from the inverter. For determin-
ing the energy supplied to the grid, only the readings of the calibrated meter supplied by
the electric utility company are relevant.
Yield
Amount of money earned during the peri-
od of time in question (currency can be se-
lected in the Setup menu)
As was the case for the output energy, readings may differ from those of other instru-
ments.
'The Setup menu' section describes how to set the currency and rate for the output ener-
gy. The factory setting depends on the respective country-specific setting.
CO2 reduction
CO2 emissions saved during the monitored period
(kg / T; T = tons)
The area for unit display switches between ‘kg’ or ‘T’ and ‘CO2.’
The CO2 meter gives an indication of CO2 emissions that would be released during the
generation of the same amount of electricity in a combustion power plant.
The factory setting is 0.59 kg / kWh (source: DGS - the German Society for Solar Energy).
Maximum output power
Highest output power of the inverter dur-
ing observation period (watts)
Maximum grid voltage
Highest reading of grid voltage (V) during
observation period