2 trend view menu, 3 trend view menu – K-Patents PR-23 for K-Patents Appendix User Manual
Page 25
Electronic Data Capture and Storage
4
© Copyright K-Patents 2013. All rights reserved.
25
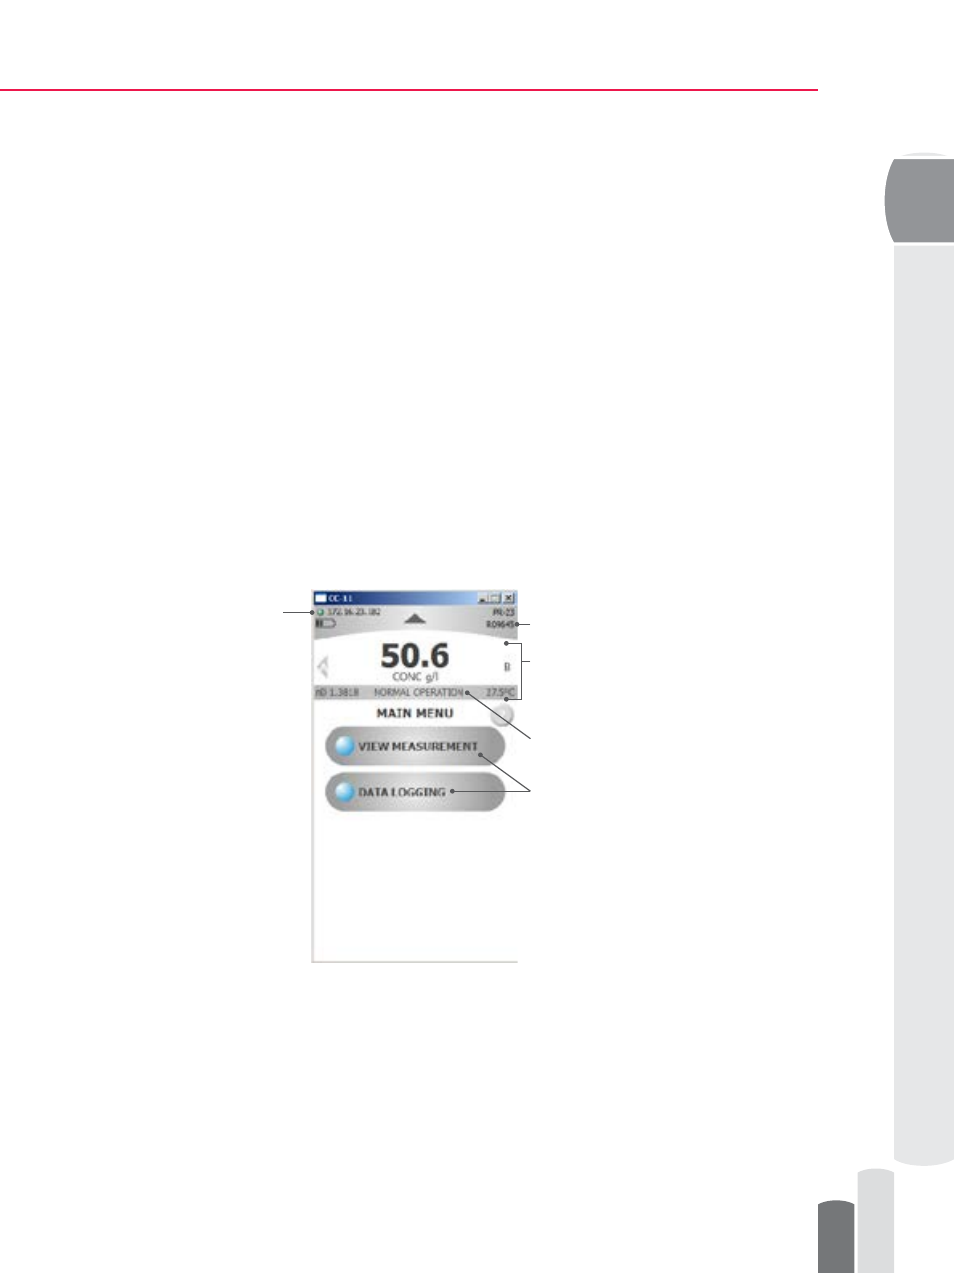
displayed at all times. The IP address of the connected refractometer is displayed in the
upper left corner. The color of the light in front of the IP address indicates the status of
the connection.
Light
Status of the connection
Green
CC-11 is connected to the refractometer
Yellow
CC-11 is searching for the refractometer
Red
CC-11 is disconnected.
In the upper right corner, the name and Serial Number of the connected refractometer is
displayed. If two sensors are connected to the CC-11 program, it is possible to display
values for each sensor by pressing A or B. Concentration, refractive index n
D
and
temperature will be displayed for the chosen sensor. Depending on the status of the
refractometer, a status message will be displayed.
The main menu (Figure 4.2) provides access to the functions of the CC-11. The main menu
consists of two colored selection buttons. The colored selection buttons can be used to:
− VIEW MEASUREMENT: view measurement data and status
− DATA LOGGING: to log data into a log-file
Status of
connection
Sensor Serial Number
Access to functions
Measurement data
Sensor Diagnostic status
Figure 4.2 Computer Communication software CC-11: Functions and Main menu
4.2.3 Trend View Menu
By choosing either VIEW MEASUREMENT or DATA LOGGING measurement data can
be viewed on a graph or logged into a PDF file. The logged data is date and time stamped
indicating the logging starting and stopping dates and times.
The plotted measurement value can be changed by clicking on the grey area of the y-axis.
The plotted measurement value can be either CALC, CONC, T or n
D
.