La Crosse Technology WS-1910 User Manual
Page 5
17
RELATIVE PRESSURE REFERENCE VALUE SETTING
Note:
The default reference pressure value of the barometer is 29.91inHg (1013 hPa) when
batteries are first inserted. For an exact measurement, it is necessary to first adjust
the barometer to your local relative air pressure (related to elevation above sea
level). Ask for the current atmospheric pressure of your home area (Local weather service,
www, optician, calibrated instruments in public buildings, airport).
The relative air pressure can be manually set to another value within the range of 27.14 to
31.90 inHg (919 to 1080 hPa) for a better reference.
1.
The current relative pressure value will start flashing
2.
Use the + or MIN/MAX key to increase or decrease the value. Keep holding the key
will allow the value to increase faster.
3.
Confirm with the SET key and enter the WEATHER TENDENCY THRESHOLD
VALUE SETTING.
Note:
This calibration facility is useful for those users living at various elevations above sea level,
but wanting their air pressure display to be based on sea level elevation.
WEATHER TENDENCY THRESHOLD VALUE SETTING
You may select a definite switching sensitivity value, .06, .09, or .12 inHg (2-4 hPa) for the
change in the display of weather icons. This represents the "sensitivity" of the weather
Flashing
Flashing
18
forecast (the smaller the value selected, the more sensitive the weather forecast). The
default value is 0.09 inHg (3 hPa).
1.
The threshold value will start flashing
2.
Use the + or MIN/MAX key to select the value.
3.
Confirm with the SET key and enter the STORM WARNING THRESHOLD VALUE
SETTING.
STORM WARNING THRESHOLD VALUE SETTING
You may also define a switching sensitivity value for the Storm warning display at a
decrease of air pressure from .09 inHg to .27 inHg (3-9 hPa) over 6 hours (Default 0.15
inHg (5 hPa)).
1.
The threshold value will start flashing.
2.
Use the + or MIN/MAX key to select the value.
3.
Confirm with the SET key and enter the STORM ALARM ON/ OFF SETTING.
STORM ALARM ON/ OFF SETTING
Note: the storm alarm ON/OFF setting is not available on this model. Skip and exit
this setting by pressing the SET key.
TO EXIT THE MANUAL SETTING MODE
To exit the manual setting anytime during the manual setting modes, press the HISTORY
key anytime or wait for the automatic timeout. The mode will return to the normal time
display.
WEATHER FORECAST AND WEATHER TENDENCY
WEATHER FORECASTING ICONS
Weather icons in the third section of LCD can be displayed in any of the following
combinations:
Flashing
19
For every sudden or significant change in the air pressure, the weather icons will update
accordingly to represent the change in weather. If the icons do not change, then it means
either the air pressure has not changed or the change has been too slow for the Weather
station to register. However, if the icon displayed is a sun or raining cloud, there will be no
change of icon if the weather gets any better (with sunny icon) or worse (with rainy icon)
since the icons are already at their extremes.
The icons displayed forecasts the weather in terms of getting better or worse and not
necessarily sunny or rainy as each icon indicates. For example, if the current weather is
cloudy and the rainy icon is displayed, it does not mean that the product is faulty because
it is not raining. It simply means that the air pressure has dropped and the weather is
expected to get worse but not necessarily rainy.
Note:
After setting up, readings for weather forecasts should be disregarded for the next 48-60
hours. This will allow sufficient time for the Weather station to collect air pressure data at a
constant altitude and therefore result in a more accurate forecast.
Common to weather forecasting, absolute accuracy cannot be guaranteed. The weather
forecasting feature is estimated to have an accuracy level of about 75% due to the varying
areas the Weather station has been designed for use. In areas that experience sudden
changes in weather (for example from sunny to rain), the Weather station will be more
accurate compared to use in areas where the weather is stagnant most of the time (for
example mostly sunny).
If the Weather station is moved to another location significantly higher or lower than its
initial standing point (for example from the ground floor to the upper floors of a house),
discard the weather forecast for the next 48-60 hours. By doing this, the Weather Station
will not mistake the new location as being a possible change in air-pressure when really it
is due to the slight change of altitude.
WEATHER TENDENCY INDICATOR
Working together with the weather icons is the weather tendency indicators (located on the
left and right sides of the weather icons). When the indicator points upwards, it means that
Sunny
Cloudy with sunny intervals
Rainy
20
the air-pressure is increasing and the weather is expected to improve, but when indicator
points downwards, the air-pressure is dropping and the weather is expected to become
worse.
Taking this into account, one can see how the weather has changed and is expected to
change. For example, if the indicator is pointing downwards together with cloud and sun
icons, then the last noticeable change in the weather was when it was sunny (the sun icon
only). Therefore, the next change in the weather will be cloud with rain icons since the
indicator is pointing downwards.
Note:
Once the weather tendency indicator has registered a change in air pressure, it will remain
permanently visualized on the LCD.
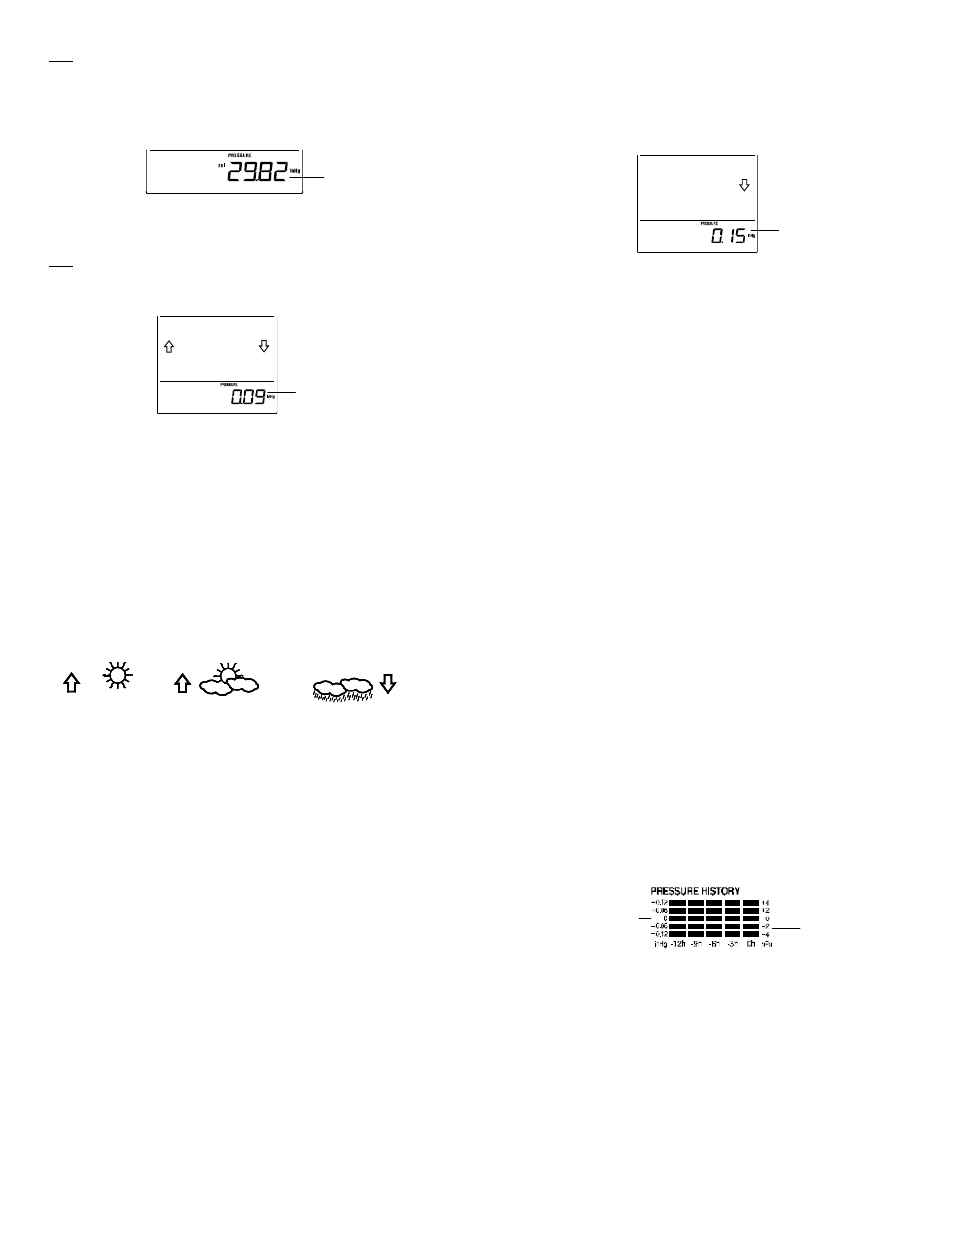
AIR PRESSURE HISTORY (ELECTRONIC BAROMETER WITH
BAROMETRIC PRESSURE TREND)
The bottom section of the LCD also shows the relative air pressure value and the air
pressure history.
Depending on programming conditions, display of the history of air pressure in form of a
graph consisting of vertical bars.
The bar graph of the electronic barometer shows the air pressure history of the past 12
hours in five 3-hour steps.
The horizontal axis represents the last 12 hours air pressure recording (-12, -9, -6, -3 and
0 hour). The bars are plotted at each of the 5 steps and give the trend over the recorded
period. The scale on the right compares the result. The "0" in the middle of this scale
determines the current air pressure.
The vertical axis represents the air pressure changes in inHg (+0.12, +0.06, 0, -0.06, -0.12.
The “0” represents the current air pressure). The newly measured pressure was compared
to the previously recorded pressure reading. The pressure change is expressed by the
difference between the current ("0h") and the past readings in division of ±2 hPa or ±0.06
inHg. If the bars are rising it indicates that the weather is getting better due to an increase
in air pressure. If the bars go down it indicates a drop of the air pressure and the weather
Air pressure
changes in inHg
Air pressure
changes in hPa