La Crosse Technology WS-1910 User Manual
Page 6
21
is expected to get worse from the present time "0".
At every full hour, the current air pressure is used as a basis for the display of a new graph
bar. The existing graph is then moved one column to the left.
Note:
For accurate barometric pressure trend, the Weather Center should operate at the same
altitude. For example, it should not be moved. Should the unit be moved, for instance from
the ground to the second floor of the house, the readings for the next 48-60 hours shall be
discarded.
WIND SPEED MEASUREMENT
In normal display mode, the second section of the LCD shows the following wind data.
Wind chill in
F or C
Wind Speed in km/h, mph or m/s
Gust in km/h, mph or m/s (displayed when in Mode 2, by pressing the SET key
shortly)
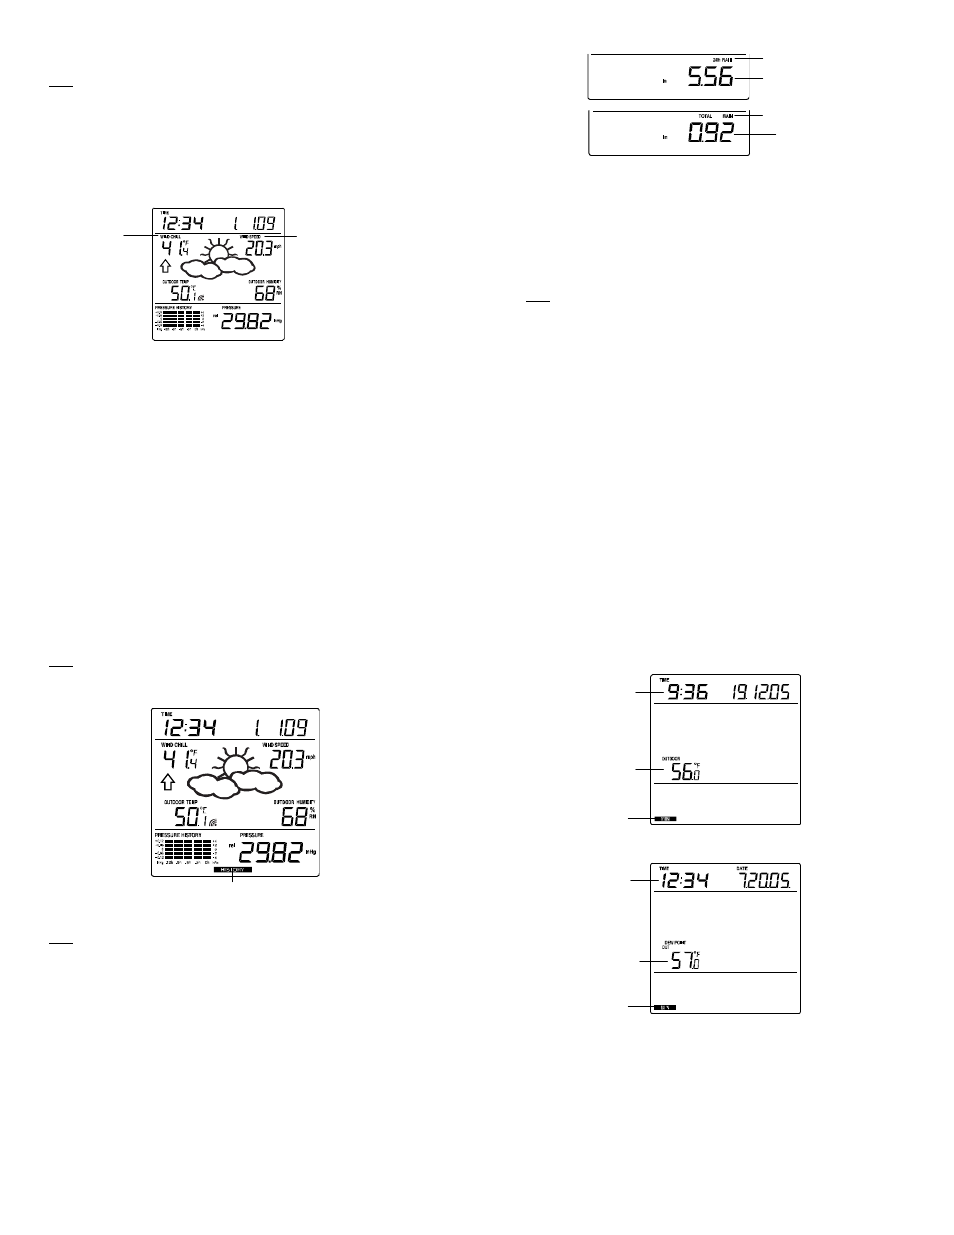
RAINFALL MEASUREMENT (OPTIONAL)
The total rainfall and 24 hour rainfall measurement is displayed in the last section of the
LCD, in the unit of mm or inch.
To View the 24-hour rainfall or the Total rainfall reading:
1.
In normal display, press SET key once and the display will shift to Mode 2.
2.
Press + key consecutively key to toggle between the 24-hour rainfall, Total rainfall
and Rel. pressure reading.
Wind speed or Gust will
be shown
Wind chill
22
VIEWING THE HISTORY DATA
The weather station can store up to 140 sets of weather data which are recorded
automatically at 3-hour intervals after the weather station is powered up, at the nearest
time of 0:00, 03:00, 06:00, 09:00, 12:00, 15:00, 18:00 and 21:00. For instance, if user has
manually set the time as 14:52 after installing batteries, the first history record will be
made at the coming 15:00 automatically. Then the second record will be on 18:00 and so
on.
Each weather record includes the Wind direction, Wind speed/ gust in Beaufort scale,
Wind chill temperature, wind speed/gust, dew point, Outdoor temp and humidity, relative
pressure, 24-hour rainfall and total rainfall, pressure history and weather tendency. Also,
the time and date of recording will be displayed.
Note:
In order to acquire the correct time of recording of the history records, you shall manually
set the current time as soon as installing batteries to the weather station. Afterwards, you
should avoid changing the pre-set time as it will also alter the recorded "time of recording"
of each history record, which may lead to confusion.
To view the weather history:
1.
In normal display, press the HISTORY key. The latest weather record will be shown
with the date and time of recording. The "HISTORY" icon will be displayed at the
bottom of the LCD.
2.
When viewing History records, user may shift to see the Mode 1 or Mode 2 data by
pressing the SET key.
Mode 1: with wind speed + outdoor Temp + Rel. pressure;
Mode 2 : with wind gust + Dew point + rainfall data (optional)
24 hour rainfall icon
Total rainfall icon
24 hour rainfall amount
Total rainfall amount
23
Note: To view total rainfall or 24-hour rainfall in history records, first, in normal display
mode, choose to show the particular rainfall data, then press the History key followed by
the SET key to view the particular rainfall data in History records. (rain data information
only available if a rain sensor is being used- optional).
3.
When viewing History records, press MIN/ MAX to view older records.
(Press MIN/MAX and + key to view "Previous" and "Next" record respectively. The
records are made at 3-hour intervals)
Note:
The stored history records will not be retained after battery change or whenever
battery is removed.
The total rainfall value will be exhibited in whole number (no decimal place) in the
history record.
VIEWING THE MAXIMUM/ MINIMUM WEATHER DATA
The weather station will record the maximum and minimum value of the various weather
data with time and date of recording automatically. The following stored maximum and
minimum weather data can be viewed by pressing the MIN/MAX key in normal display
mode.
HISTORY icon
24
1.
MIN outdoor temperature with the date and time of recording
2.
MAX outdoor temperature with the date and time of recording
3.
MIN dew point temperature
4.
MAX dew point temperature
5.
MIN outdoor humidity with the date and time of recording
MIN icon
MIN outdoor
temperature value
Time and date
or recording
MIN icon
MIN Dew Point
temp
Time and date
or recording