Super Systems e-TRIM User Manual
Page 15
Super Systems Inc. Page 15 of 27
e-TRIM Operations Manual
The button on the left -
- is the Trend Lines button. This button will allow the user to
select which trend lines (data points) to display on the chart, as well as view statistics for each
data point. Note – Removing a trend line from display does not stop logging the data for that
point. If the checkbox is checked, that data point will be displayed on the chart. If the checkbox
is unchecked, the data point will not be
displayed. Clicking on the check box will
toggle between checked and unchecked.
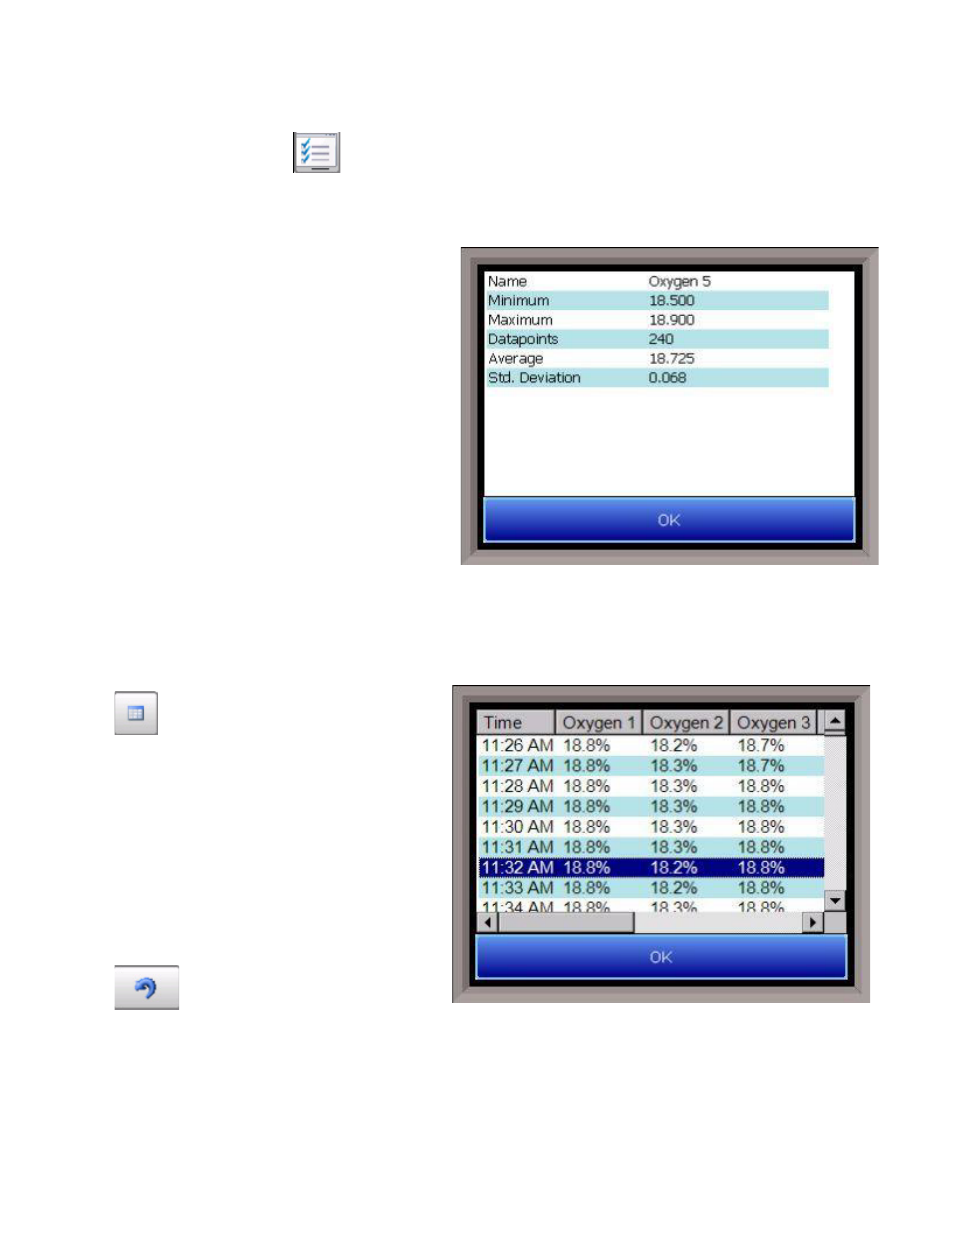
The “fx” button will display the statistics for
the selected data point. The statistics that
are displayed are: the name of the data
point, the minimum value for the date/time
range, the maximum value for the
date/time range, the number of data points
in the date/time range, the average value
for the date/time range, and the standard
deviation for the date/time range.
The OK button will save any changes made and close down the Trend Lines screen. The Cancel
button will simply close down the Trend Lines screen and not save any changes that have been
made.
- is the datagrid button. This will
display all of the data points for the trend
lines in a column format. The date/time
range for the display will be the same as
the date/time range for the chart.
- is the undo button. This will
undo any zooming on the chart and return it to the original aspect.