Figure 20 – H3C Technologies H3C Intelligent Management Center User Manual
Page 74

65
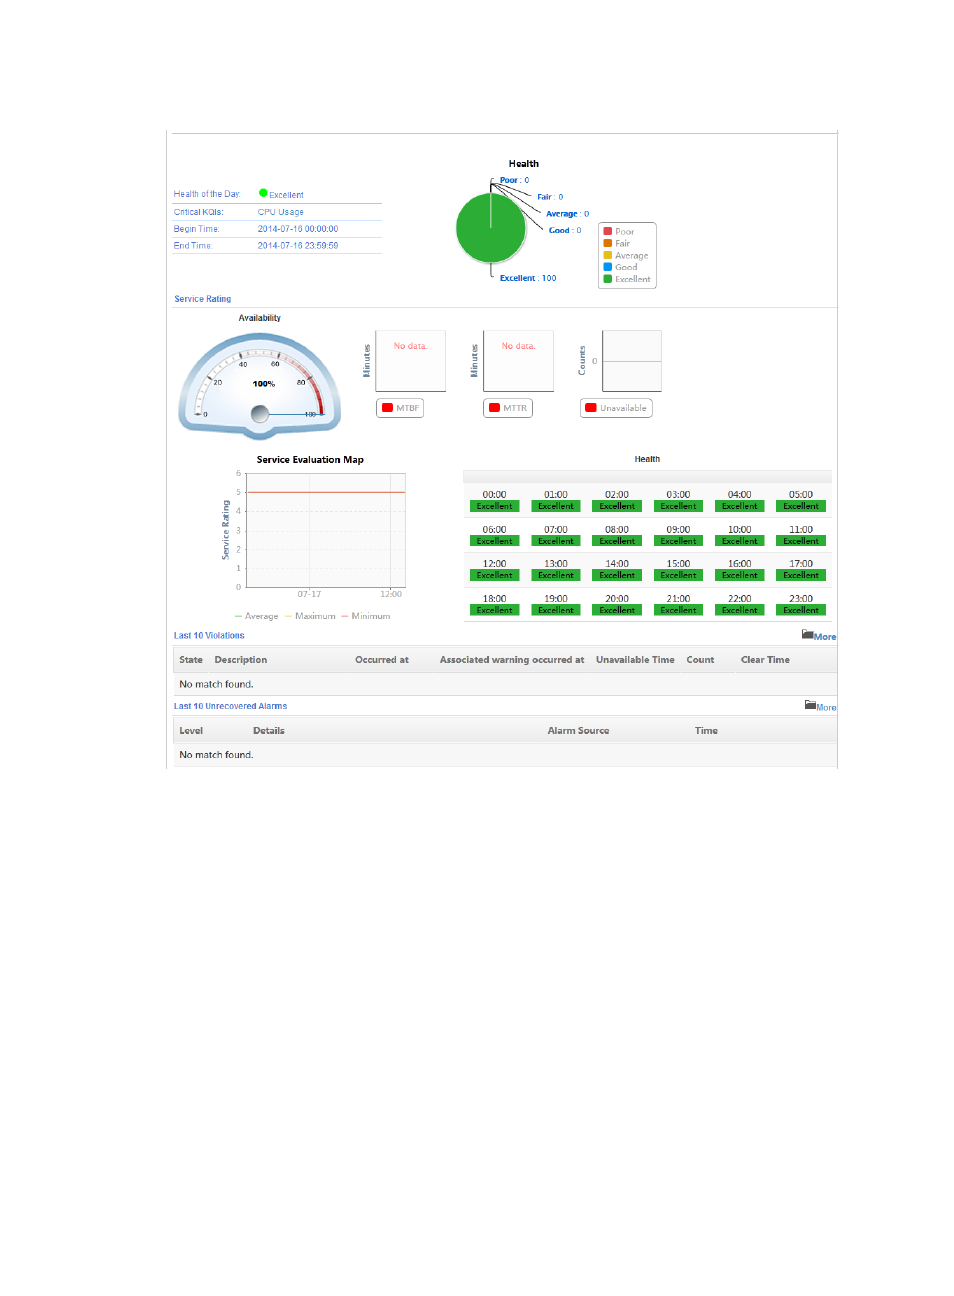
Figure 20 Health area
Health area fields:
•
Summary Pane—Displays the healthy status, critical KQI, start time, and end time. Click the name
of the critical KQI to view the critical KQI information.
•
Health—Displays the percentage information relating to the overall health in a pie chart during the
selected time range.
•
Availability—Displays the availability percentage of the service during the selected time range in
a dashboard.
•
MTBF—Displays the Mean Time Between Failures of the service in a bar chart to reflect the
unavailability ratio.
•
MTTR—Displays the Mean Time to Repair of the service in a bar chart to reflect the respond
efficiency.
•
Unavailability—Displays the times of service unavailabilities.
•
Service Evaluation Map—Displays the average value, the maximum, and the minimum of the
service rating in a line chart.
•
Health—Displays the health status for each time range unit in a table. If no data exists, the field
displays hyphens (- -).