10 sdnm widgets, Controller alert statistics – H3C Technologies H3C Intelligent Management Center User Manual
Page 134
124
10 SDNM widgets
SDN Manager provides the following widgets for an OpenFlow network:
•
Controller Alert Statistics
•
OF Device Status Statistics
•
Today Controller Traffic Rate Chart
•
Today Tenant Traffic Rate Chart
To easily view the running status of the OpenFlow network, customize the widgets on the IMC home page.
For more information, see HP Intelligent Management Center v7.0 Enterprise and Standard Platform
Administrator Guide.
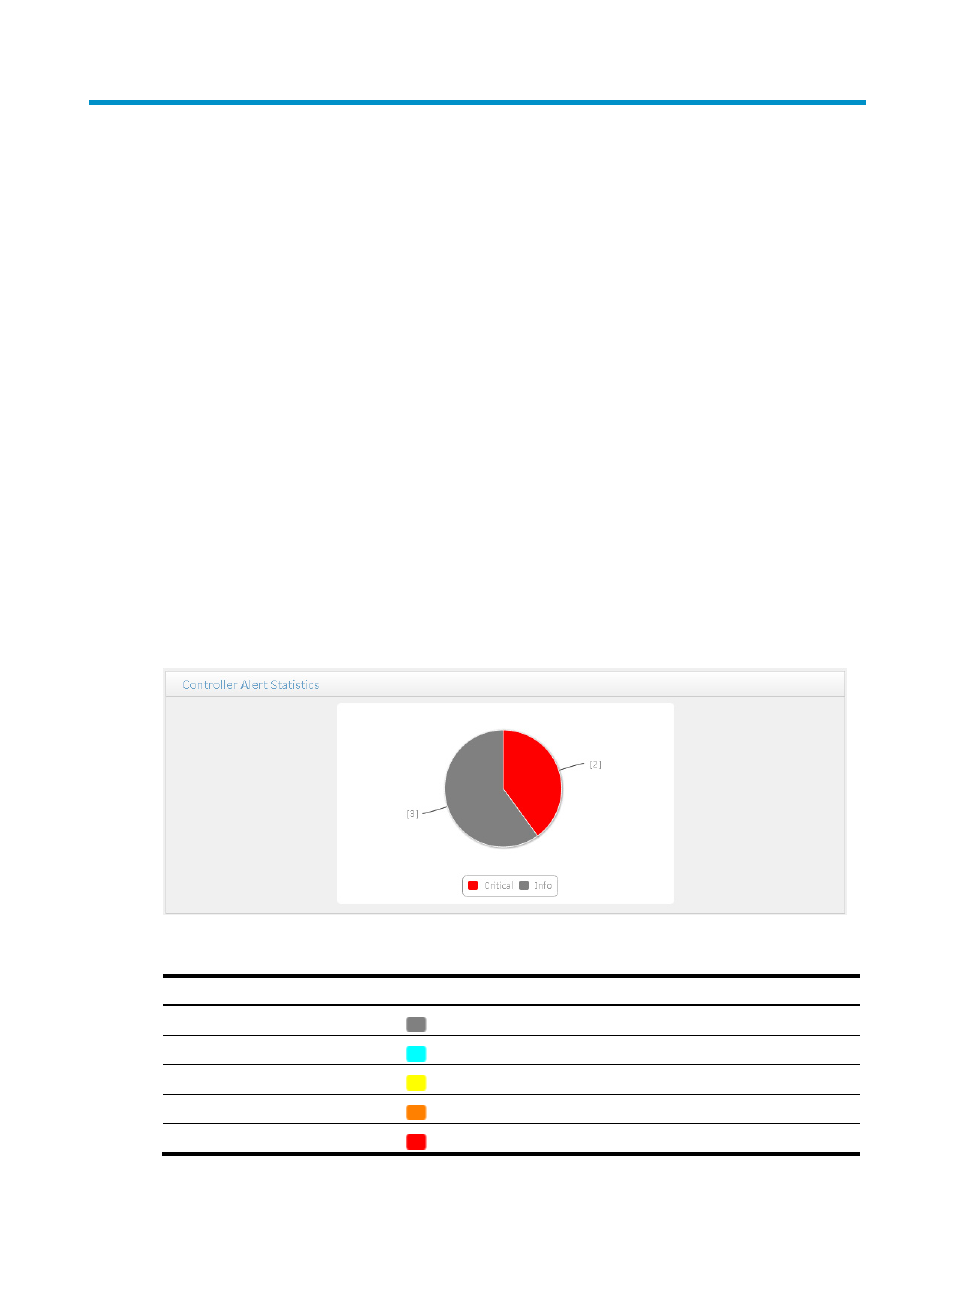
Controller Alert Statistics
As shown in
, the controller alert statistics widget displays the number of controller alerts of
different levels in SDNM. You can perform the following operations:
•
Move the pointer over a slice of the pie chart to view the number of alerts.
•
Click a slice to view the corresponding alert list.
•
Click the corresponding alert level legend in the illustration to hide or display an alert slice.
Figure 48 Controller Alert Statistics widget
Table 12 Alerts and colors
Status Icon
Color
Info
Gray
Warning
Cyan
Minor
Yellow
Major
Orange
Critical
Red