Viewing the controller alert statistics, Viewing the tenant traffic rate chart – H3C Technologies H3C Intelligent Management Center User Manual
Page 26
16
•
Receive Traffic—Traffic volume (in KB) received by the controller from 00:00:00 of the day to the
current time.
•
Transmit Packets—Number of the packets transmitted by the controller from 00:00:00 of the day to
the current time.
•
Receive Packets—Number of the packets received by the controller from 00:00:00 of the day to the
current time.
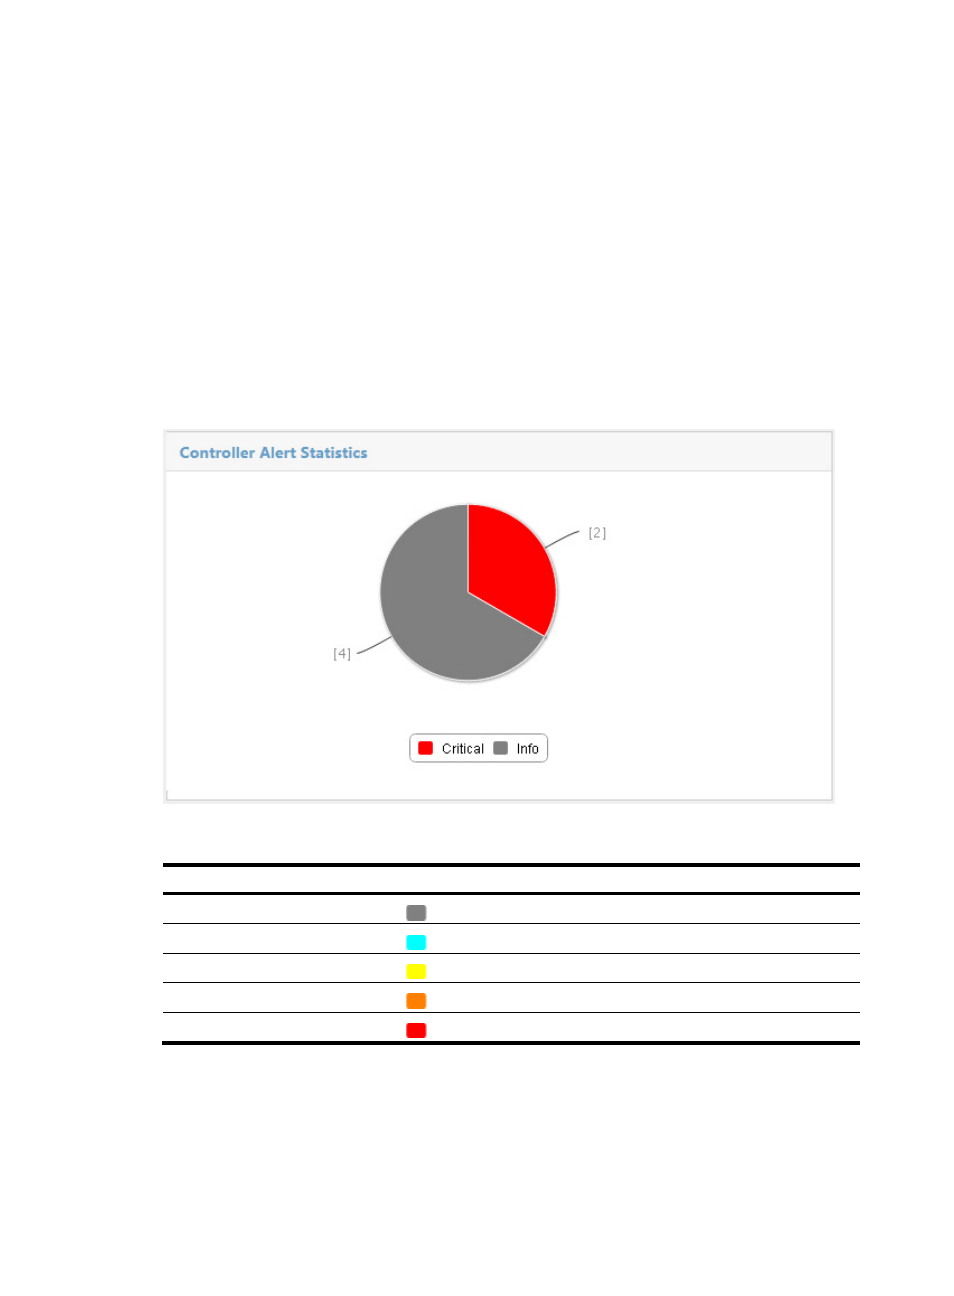
Viewing the controller alert statistics
Controller Alert Statistics displays the number of unrecovered controller alerts at different levels.
Move the pointer over a slice of the pie chart to view the number of alerts at that level. Click a slice to view
the list of alerts at that level.
Figure 13 Controller alert statistics
Table 4 Alerts and colors
Status Icon
Color
Info
Gray
Warning
Cyan
Minor
Yellow
Major
Orange
Critical
Red
Viewing the tenant traffic rate chart
By default, Tenant Traffic Rate Chart displays the receiving and transmitting rate trend of a tenant with the
highest traffic volume from 00:00:00 of the day to the current time.