Tenant traffic rate chart – H3C Technologies H3C Intelligent Management Center User Manual
Page 88
78
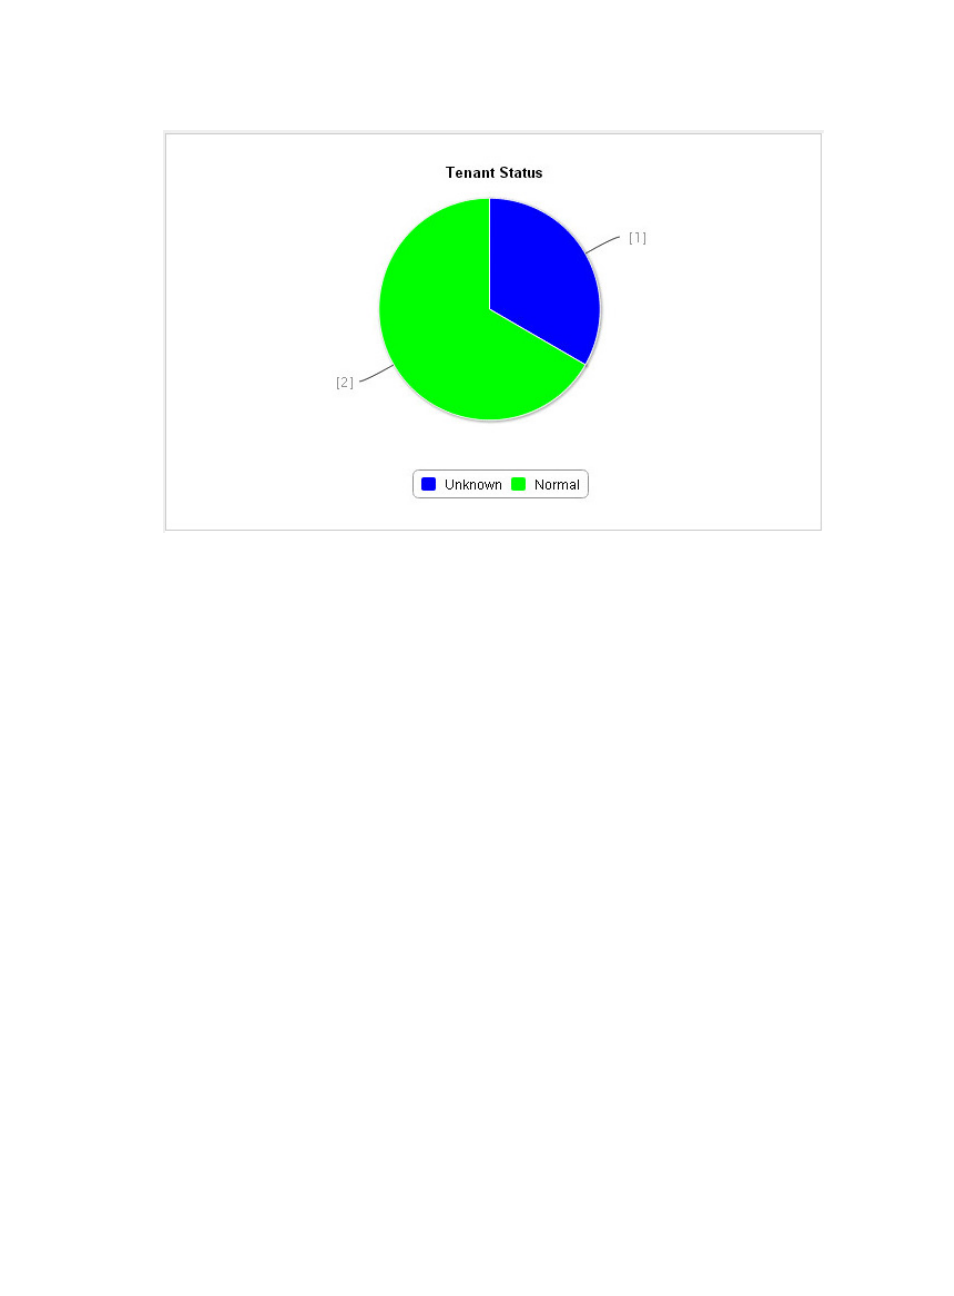
Figure 26 Tenant status
Tenant traffic rate chart
The tenant traffic rate chart displays the receiving and transmitting rate trend of virtual OpenFlow devices
rent by a tenant over a time range. The x-axis shows the time. The y-axis shows the rate. The receiving and
transmitting rates are represented in different colors.
By default, the chart displays the rate trend from 00:00 to the current time.
1.
Click 1h, 1d, 1w, 1m, or 1y to view the tenant rate trend over the most recent hour, most recent
day, most recent week, most recent month, or most recent year, respectively, or click Customize to
set the start time and end time for query.
2.
Select the tenant to view from the Select Tenant list.
3.
Click a legend to hide or show the rate in the line chart.