Typical performance graphs – Linx Technologies TXM-xxx-ES User Manual
Page 5
Advertising
– –
– –
4
5
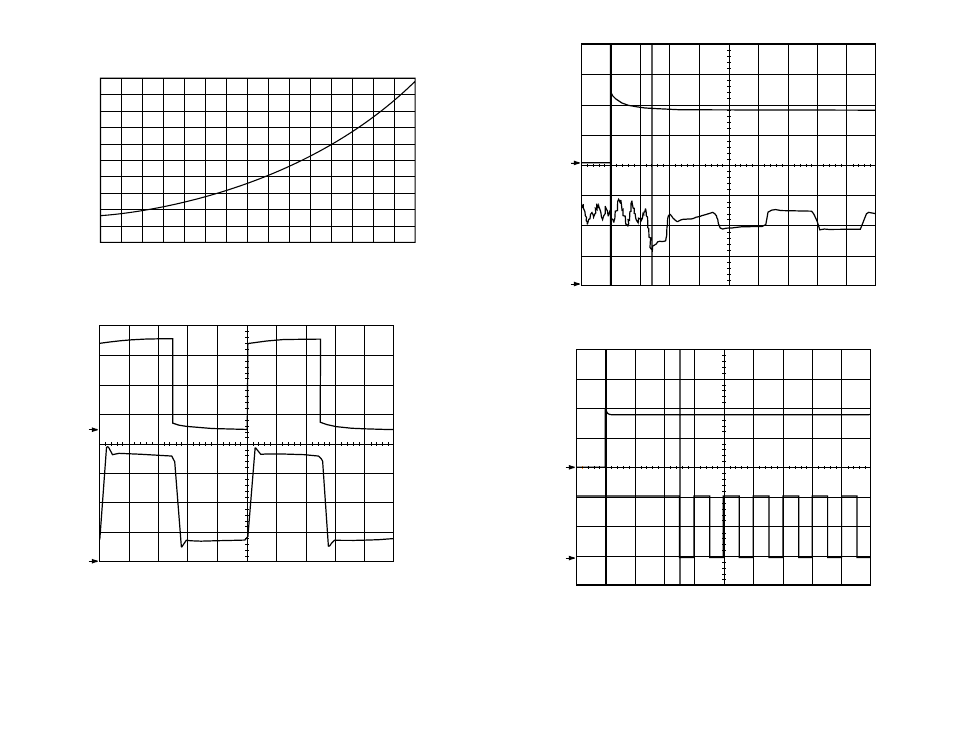
Typical Performance Graphs
Figure 5: Level Adjust Attenuation
Figure 6: Square-Wave Modulation Linearity
RF Output Attenuation (dB)
-8.0
-6.0
-4.0
-2.0
-1.0
-0.4
-0.2
-10
40
35
30
25
20
15
LADJ to GND (k
Ω
)
CH1 1.66V CH2 100mV 250uS
1
2
IN
OUT
Figure 8: Tx Powerup to Valid Rx Data
Figure 7: Tx Powerup to Valid Rx Analog
CH1 2.00V CH2 2.00V 1mS
1
2
Tx VCC/PDN
RX Data
CH1 2.00V CH2 500mV 100uS
1
2
Tx VCC/PDN
Rx Demodulated Analog Data
Advertising
See also other documents in the category Linx Technologies Hardware:
- EVAL-xxx-KH3 (9 pages)
- TXM-xxx-KH3 (19 pages)
- HUM-xxx-DT (37 pages)
- HUM-xxx-RC (31 pages)
- TRM-xxx-TT (29 pages)
- MDEV-xxx-DT (19 pages)
- MDEV-xxx-RC (25 pages)
- TRM-xxx-NT (23 pages)
- RXM-GNSS-GM (27 pages)
- ASY-MDEV-GPS-SR-DB (9 pages)
- EVM-GPS-RM (5 pages)
- MDEV-xxx-TT (23 pages)
- EVM-GNSS-GM (5 pages)
- MDEV-xxx-NT (13 pages)
- MDEV-GPS (9 pages)
- EVM-868-EUR (9 pages)
- TRM-915-R25 (39 pages)
- EVM-915-025 (9 pages)
- TRM-868-EUR (25 pages)
- EVM-868-EUR (16 pages)
- TRM-xxx-DP1203 (15 pages)
- RXM-GPS-R4 (19 pages)
- RXM-GPS-F4 (25 pages)
- EVM-GPS-F4 (7 pages)
- EVM-GPS-R4 (5 pages)
- MDEV-GPS-F4 (16 pages)
- TRM-xxx-LT (19 pages)
- EVAL-xxx-LT (9 pages)
- TXM-xxx-LR (17 pages)
- RXM-xxx-LR (19 pages)
- EVAL-xxx-ES (9 pages)
- TXM-xxx-LC (17 pages)
- TXE-xxx-KH2 (11 pages)
- RXD-xxx-KH2 (11 pages)
- EVAL-xxx-KH2 (5 pages)
- RXM-xxx-ES (17 pages)
- MDEV-xxx-ES (11 pages)
- TXM-900-HP3-xxx (13 pages)
- RXM-900-HP3-xxx (13 pages)
- MDEV-900-HP3-xxx (7 pages)
- RXM-GPS-SG (17 pages)
- ASY-MDEV-GPS-SG-DB (3 pages)
- RXM-GPS-SR (15 pages)
- MDEV-GPS-SR (8 pages)