1 wan – PLANET BM-2101 User Manual
Page 256
17.1 WAN
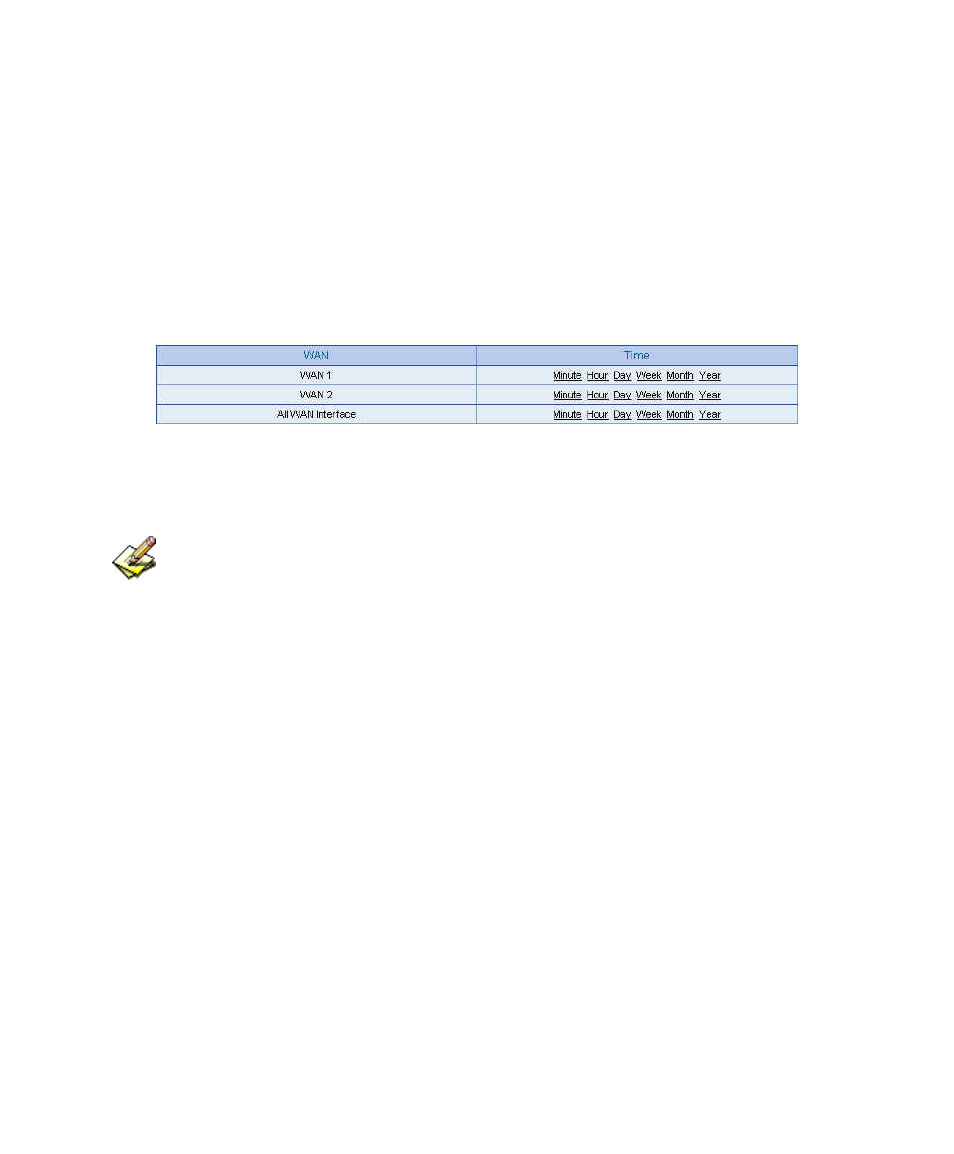
Step1 Statistics Æ WAN , it shows all the downstream/upstream packets and
statistics pass through WAN interface.
Time View the statistics charts according to the unit of minute, hour ,
da , week , month, year.
The WAN statistics
The WAN statistics is the attached function of WAN interface. The WAN statistics will enabled
when enable the WAN interface.
Step2. Statistics Æ WAN , select the WAN to view. MIS engineer can click
Minute , to view the statistic charts results in every minute
Click Hour ,
to view the statistic charts results in every hour. Click Day , to view the
statistic charts results in every day.Click Week , to view the statistics charts
results in every week. Click Month , to view the statistics results in every
month.
Click Year , to view the statistics charts results in every year.