X-Treme Audio XTI User Manual
Page 3
1. General Information: what is the X-Treme Installer?
X-Treme Installer (XTI) is proprietary software designed to carry
out a virtual installation with X-Treme audio systems, in order to
calculate the sound distribution produced in a three-dimensional
space by an installation in free field conditions. Line arrays, single
sources, and subwoofers, chosen from a list of X-Treme products,
can be arbitrarily placed and oriented in a virtual three-dimensional
space. Also, starting with four-sided planes, arbitrary three-dimen-
sional audience areas can be created. The software will provide
several representations of the maximum continuous SPL distribu-
tion in the various areas of the virtual venue (broadband and octave
bands) as output. XTI automatically calculates an optimal geomet-
ric configuration (Autosplay function) for array installations, starting
with a field analysis of the sound produced for a series of possible
configurations.
2. Working principles
The following is an overview of XTI’s working principles.
The input data of the program is represented by the speaker data
files. There is one file per speaker containing maximum SPL data,
as well as balloon attenuation, with 5° angular resolution and third
octave spectral resolution. All of this data are accurately measured
in the
Sound Corporation electro-acoustic laboratory.
Starting with this input data and the installation geometry data en-
tered by the user, the program calculates the sound pressure level
on specific planes, which are also defined by the user, using the
complex sum of each speaker entered into the project as grids
with points on the planes themselves. The complex sum allows the
phase contribution of the sound pressure - due to different distanc-
es covered by sound of different speakers and thus the resulting
acoustic interference - to be taken into consideration.
Specifically, this model results in a correct description of the array,
for which not even a minimally accurate estimate can be obtained
with a normal algorithm of the “energetic sum” (meaning “not con-
sidering the phase”, for example, see the Ray Tracing technique).
The sound is plotted on a graph in the map view with a color scale
on the ground level and on the areas set by the user, which can be
horizontal as well as inclined. It is also possible to map the level on
any vertical section by simply defining a segment on the plan view,
which matches the intersection between the plane of the desired
vertical section and the ground. In addition to the same segment,
both a graph of the sound level and a “sonogram” - which is a dia-
gram showing the variation of the sound spectrum versus space
- are available: both of these two values are interpreted along the
predefined segment at the height of the listener.
XTI is more than just a classic “aiming” software, since its three-
dimensional calculations allow for a more complete analysis
(showing horizontal sound dispersion and creating a more com-
plex representation of the venue) and it is not limited to line array
systems. The software is fundamentally based on the interference
phenomenon, which provides an accurate estimate of interactions
between speakers, providing results that are more precise than
those obtained using a Ray Tracing-based algorithm; this accuracy
becomes fundamental to describe the directivity of “periodic” (in
the space) audio systems like line arrays.
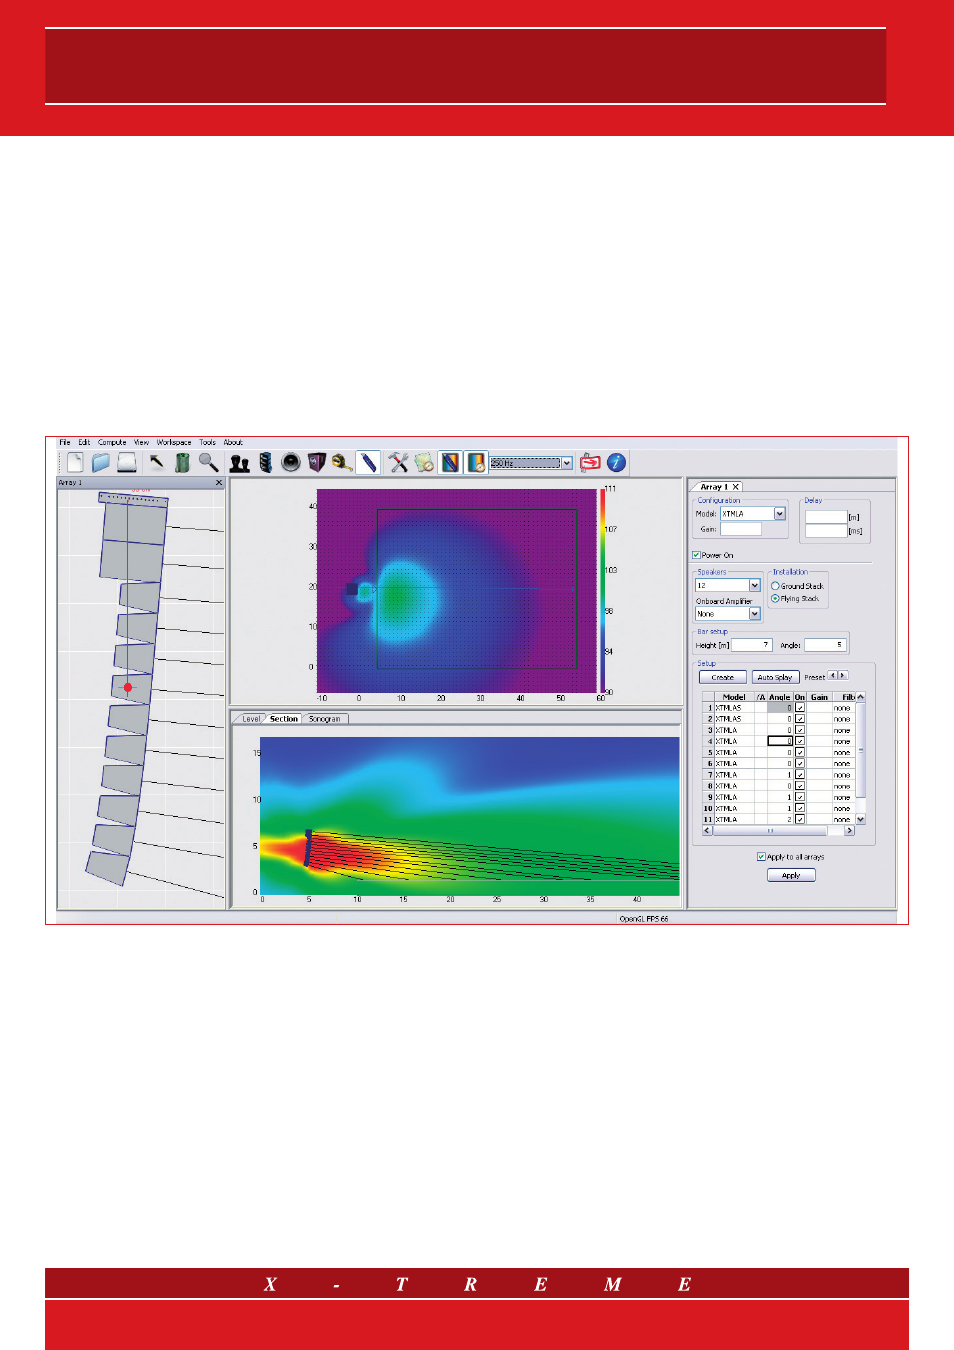
However, no interaction with the environment is modelled, which
must be considered in order to interpret the information provided
in a useful and meaningful way. Figure 1 shows a screenshot of the
main workspace.
Fig. 1 Main XTI software workspace
3/9