X-Treme Audio XTI User Manual
Page 7
For a view similar to typical 2D aiming software, just trace a seg-
ment passing through the array itself in its pointing direction (see
the picture at the top of the manual).
Section, Level and Sonogram, and the distance in meters from the
beginning of the segment - meaning the first point clicked when
created - all appear on the x-axis.
The sound level plotted in the Level view is just the section value at
listener height (measured in dB on the y-axis).
The Sonogram maps the spectrum versus the distance, with fre-
quency (Hz) on the y-axis. It provides a view of the frequency re-
sponse versus space in a single graph in order to evaluate pos-
sible spectral irregularities along the defined segment. Both in the
map and the section view, the image can be zoomed in and out
by scrolling with the mouse wheel or using “page up” and “page
down” keys. The specific window needs to have been previously
activated by clicking the
icon. The Zoom tool
selects an area in the map view and adapts it to the window it
contains.
Panning is performed by dragging while holding down the mouse
wheel or using the keyboard arrows.
Fig. 7 Detail of the acoustic map calculation
10. Autorange
Two functions are available for color map auto-ranging.
The first icon,
is a general Autorange for which the range limits are decided based
on sound that is evaluated in the entire volume of space involved.
When enabled, this function sets these values in the setup window
and allows the user to view current data (or calculates and makes
new data appear if no data are present). If the function is disabled,
the current range values will be maintained until a new range is
manually inserted in the settings editor (allowing for “same condi-
tion comparisons” between different speaker system setups, but
risking color map saturation where the data exceed the range).
The second icon
is strictly dedicated to the plan view. When disabled, the range in
the plan view is the same as the section view. If enabled, it sets the
lowest and highest values present in the map view as limits, opti-
mizing the color range for the map view (please, be careful at color
mismatch with the two views).
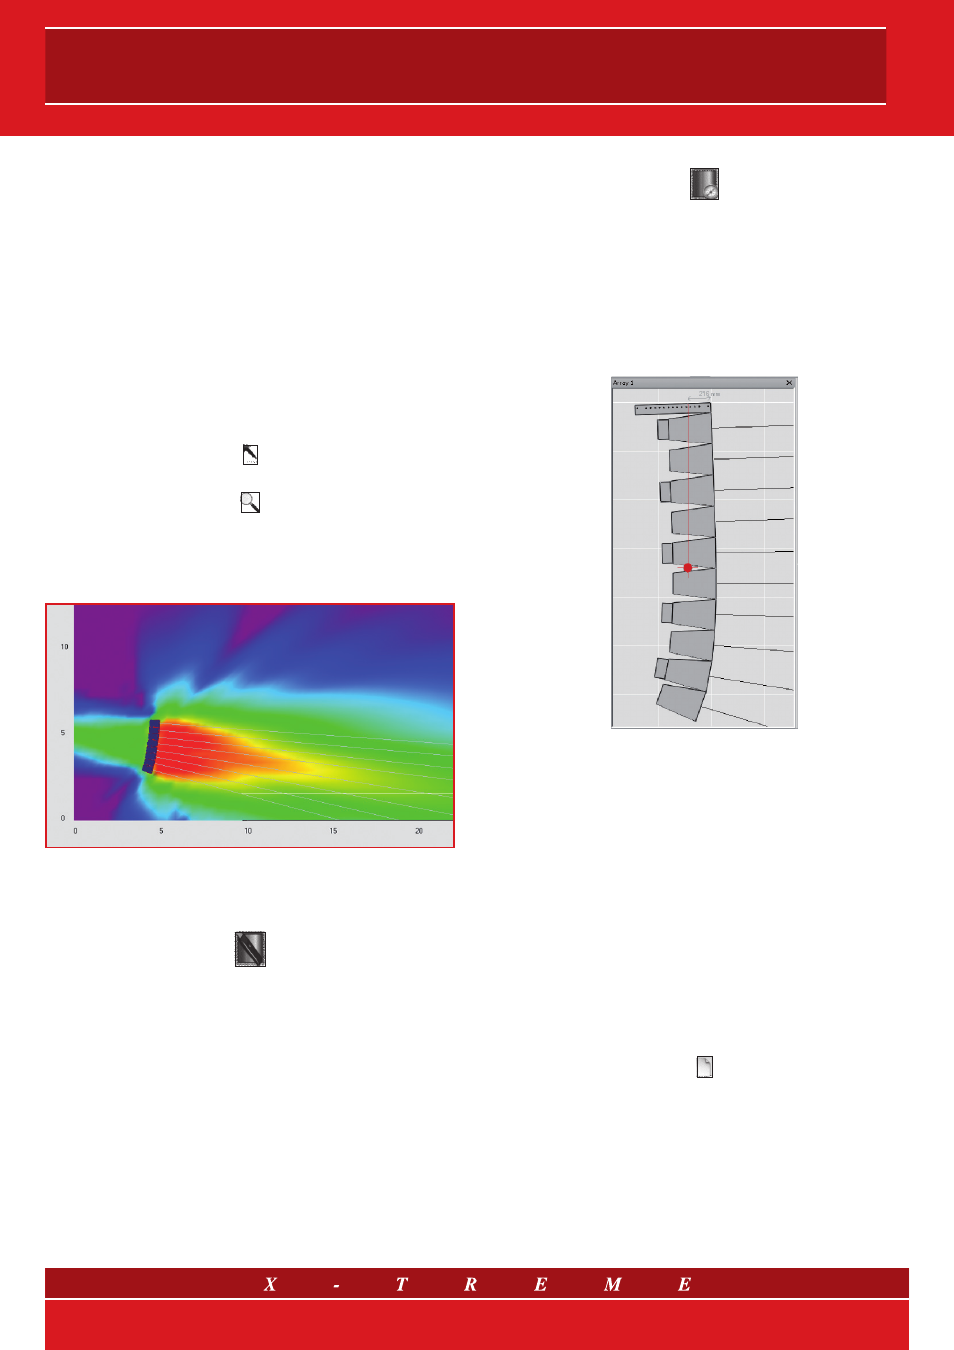
11. Array preview window
At the extreme left of the default workspace, a side view of the cur-
rently selected array is available.
Fig. 8 Preview window with indication of array mass center
The array image can be easily zoomed and panned using the same
control set for the map and section window (arrows or mouse wheel
for Panning and page up-down or mouse wheel for Zooming). The
utilities offered by this view are:
• Realistic viewing of the side appearance of the array, its curvature
as well as the presence of subwoofers and onboard amplifiers.
• Visualization of the array mass center position, its vertical projec-
tion on the rigging bar, and the distance of the projection point
from the front edge of the bar. The flying bar is correctly scaled
for each specific model as are the rigging holes (specific data are
contained in each speaker system file). Use this view to choose
the correct rigging hole, meaning the one that is closer to the
mass center vertical projection (red line).
12. Startup wizard
Starting a new project from the file menu, or simply clicking
will prompt an intuitive “wizard” that will allow you to set up a default
configuration, with a modifiable number of arrays and a rectangular
horizontal area, with modifiable dimensions and tilt.
7/9