N.4 samples of rule- and model-based monitoring – Retrotec USACE User Manual
Page 444
N14 ENERGY & PROCESS ASSESSMENT PROTOCOL
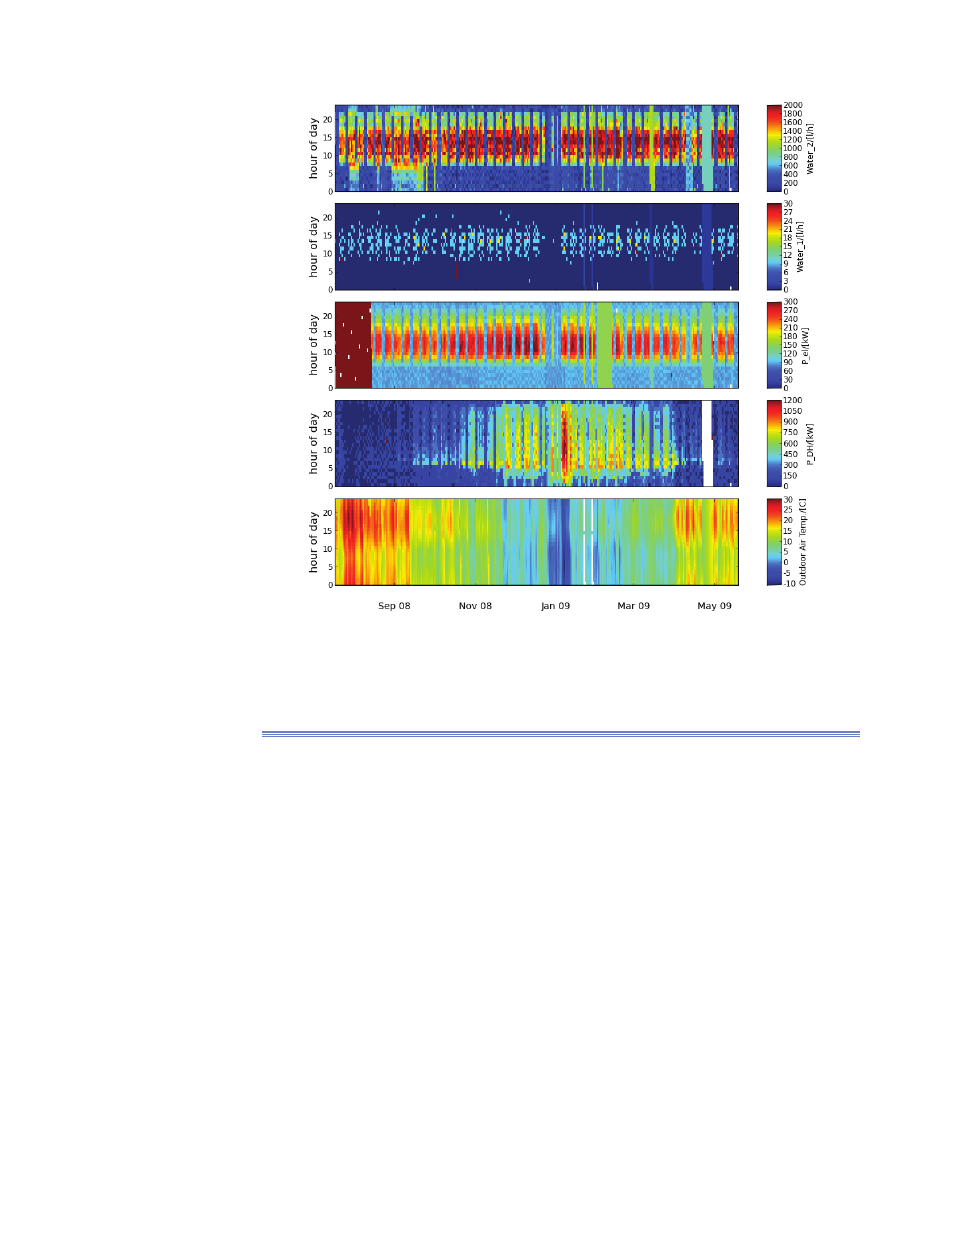
Figure N11. Carpet plot of energy and water consumption. Bottom up: outdoor air temperature,
district heat, total electricity, water (sample taken from BuildingEQ).
N.4 Samples of Rule- and Model-Based Monitoring
While the visualizations described in the previous chapters are primarily suites
to detect major wastes and ineffi ciencies during the operation of a building,
we now are entering phase 4 Regular Inspection or Continuous commission-
ing. The primary goal is to introduce an ongoing monitoring to maintain an
effi cient operation.
The situation now is characterized by a well operated and monitored build-
ing. Most of the data measured are in good agreement with the operation goals.
Only a few indicate slow decreases from optimal operation. To fi nd such indi-
cations as early as possible is the goal of rule and model based monitoring.
To reach this goal we have to describe the demand, compare demand and
consumption on an automatic way and to notify service personal if major dif-
ferences occur.
There are different ways to estimate the actual demand. Among them are
Comparison with profi les
■
Comparison with average values of previous periods
■