Getting started with tracing, Getting started with tracing -92 – Altera SoC Embedded Design Suite User Manual
Page 111
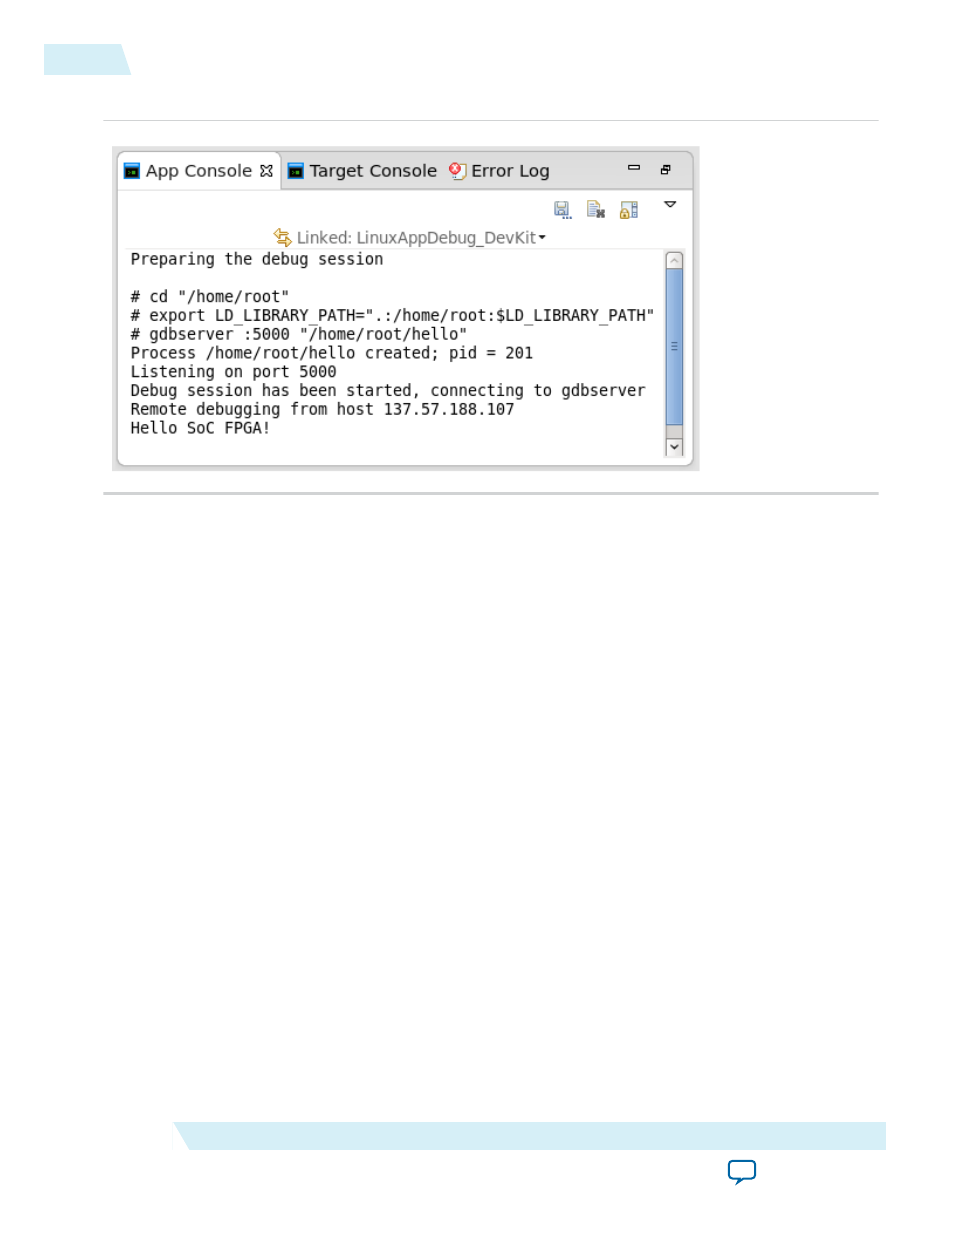
Figure 4-65: Hello Message
Getting Started with Tracing
ARM DS-5 provides powerful tracing features, allowing PTM and STM tracing. It allows different tracing
data destination types.
This section presents an example of Program Tracing using PTM and storing the tracing information in
memory using ETF.
The tracing scenario presented here uses Linux kernel debugging as an example, but any application can
be traced in the same way.
As shown, the tracing can be selected to show current core, a particular core, or follow the currently
executing thread.
The following steps are necessary in order to enable PTM tracing:
1. Execute the steps described in the
Getting Started with Linux Kernel and Driver Debugging
section
to perform Linux kernel debugging.
2. Select Run -> Debug Configurations and select the Debug Linux_DevKit configuration created at the
previous step.
3. Select the Connection tab.
4. Click the Edit DTSL Options button.
4-92
Getting Started with Tracing
ug-1137
2014.12.15
Altera Corporation
Getting Started Guides