Codan Radio Radio Repeater Systems Training Guide User Manual
Page 61
RADIO REPEATER SYSTEM | TRAINING GUIDE
Appendix E: Mobile Coverage Tests Page 53
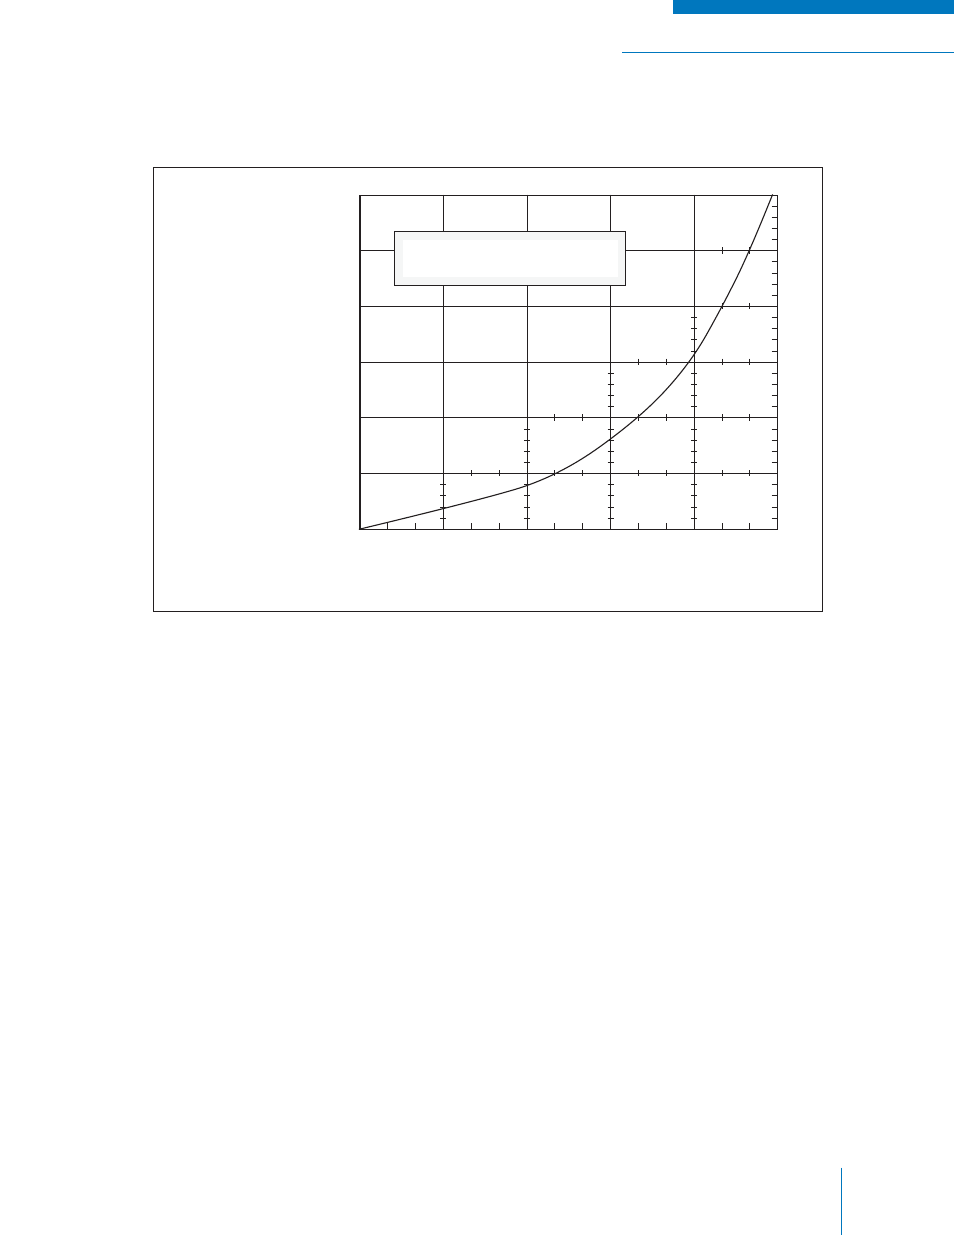
Use the graph shown in Figure E-3.
Figure E-3: Mobile Power Output vs. Attenuation
There should be coverage from the proposed site to any location that has a resulting positive fi gure.
Another method is to take the ‘Remaining Signal (dB)’ values from the Coverage test sheet and using
the Path calculation sheet (from Appendix D) as a guide, enter your “knowns” (e.g. mobile power output,
antenna gains, and cable and fi tting losses) from your testing equipment and calculate the path loss
from the site to each mobile test point. Recalculating with fi gures based on your planned equipment will
result in signal levels expected at each test point location.
The best method of measuring mobile coverage is to use radios that have been modifi ed (metered at a
limiter stage of the receiver) and calibrated to measure signal levels. The test would be run in the same
manner as discussed above.
MOBILE POWER
OUTPUT (W)
ATTENUATION (dB) NECESSARY TO
REDUCE LEVEL TO 1 WATT
0
5
10
15
20
25
0
3
6
9
12
15
30
dB = 10 log P2/P1 or
10 log MOBILE PWR / 1W