5 display menu, 1 display process values, 2 chart – Electro-Chemical Devices (ECD) CA6 Hardness Analyzer User Manual
Page 47: 3 manual step
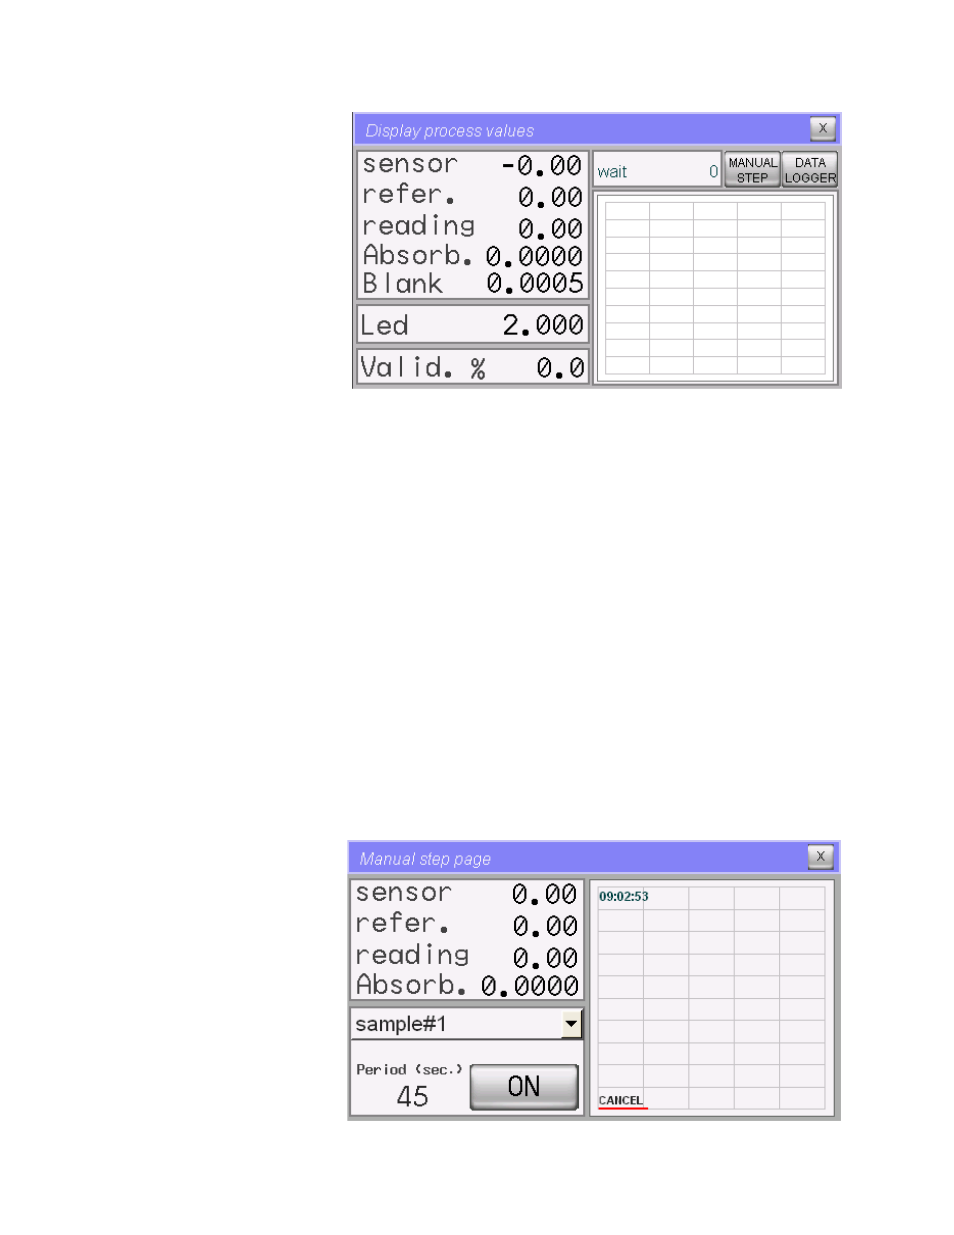
8.5 DISPLAY MENU
8.5.1 Display Process Values
The following is a list of the displayed
parameters in this menu (read only
values)
Sensor: Displays the current
measurement of the sensor
Refer: Displays the saved reference
value, typically set to 9.00. (first
point for the absorbance calculation)
Reading: Displays the saved reading
of the sensor that was used for the absorbance calculation. (second point for the absorbance calculation)
Absorb: Displays the last absorbance value calculated.
Blank: Displays the absorbance value of the Blank.
Led: Displays the led voltage supply.
Valid %: Displays the validation value in percent, current reading in calibration solution compared to the
calibration value.
Current operation: Displays the current analysis step and time (countdown for the programmed step).
8.5.2 Chart
It displays a graph of the sensor's signal trend during the current analysis cycle, scaled 0-10 arbitrary units,
readings higher than 10.00 go off the visible graph. Press CANCEL in the lower left corner of the graph to reset the
graph.
8.5.3 Manual Step
This selection provides manual control to each of the programming steps (see list in the section 2.3.1). The
operator can choose which single operation to run (select function) and set the time of the operation. This
function is protected with the 1
st
level password and is available only in STAND-BY mode.
36