Infloor Infloorboard User Manual
Page 8
www.Infloor.com
8
DESIGN & PERFORMANCE
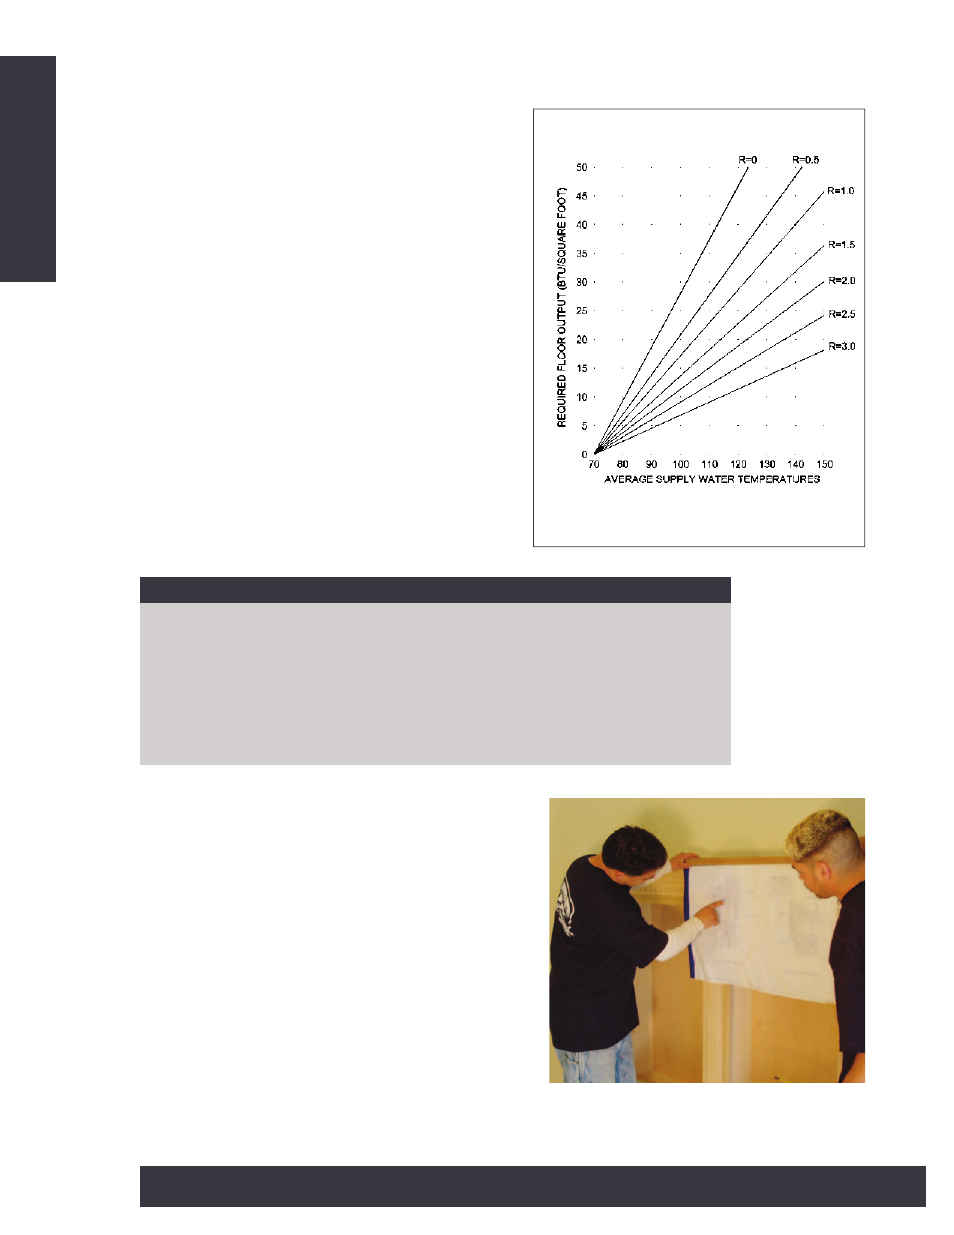
Chart C-1, can be used to estimate system output
with different floor coverings. This chart shows the
steady state performance of Infloorboard™. To
the left are the BTU/Sq. Ft/Hour. The diagonal
lines represent the resistance of the floor coverings
on top of Infloorboard™. Along the bottom is the
average water temperature required to achieve the
output. The chart is read by selecting the correct
BTU requirement and then moving horizontally
until you find the line indicating the correct R-
Value of the floor assembly on top of
Infloorboard™. At that point, drop down vertical-
ly to see average water temperature. See the previ-
ous page for a list of estimated floor covering
R-Values.
CAD LAYOUT AND DESIGN SERVICES
Third party services can provide complete system
design and CAD layouts for Infloorboard™ installa-
tion. Contact your Infloorboard™ distributor for
details. The Appendix gives an example of services
provided by the National Radiant Design Service. All
Infloorboard™ systems should be installed by quali-
fied installers.
CHART C-1
DESIGNER’S NOTE
Learn about the resistance of intended floor coverings at the design stage and
make sure they are within the requirements of the system. Realize also that
your calculation should include the resistance of the whole flooring assembly
above the Infloorboard™. If you are unfamiliar with hydronic design, good
practice and the physics of hydronic heat transfer, you should not design a
Infloorboard™ system. Consult your Infloorboard™ distributor for assistance
and referral to third party design services.
CAD layouts are particularly useful for first
time installers
.
SYSTEM OUTPUT