Overview, Groups, charts, & channels ……cv-2 – Measurement Computing TempScan/1100 User Manual
Page 134
CV-2 ChartView
988992
Software
Reference
Overview
ChartView is a graphic Microsoft Windows-based program, which was designed for ease-of-use with no need
of programming knowledge.
ChartView Plus permits multiple groups and up to four overlapping channels (per chart).
These enhanced features can be enabled by entering the following code in the authorization
dialog box (see page CV-20).
C3523DFA6C0A
Groups, Charts, & Channels
When starting the program with no configuration file present, a feature called Chart Setup Wizard is
automatically activated to assist you with your display setup. To make the best use of Chart Setup Wizard
you need to understand the relationship of Groups, Charts, and Channels.
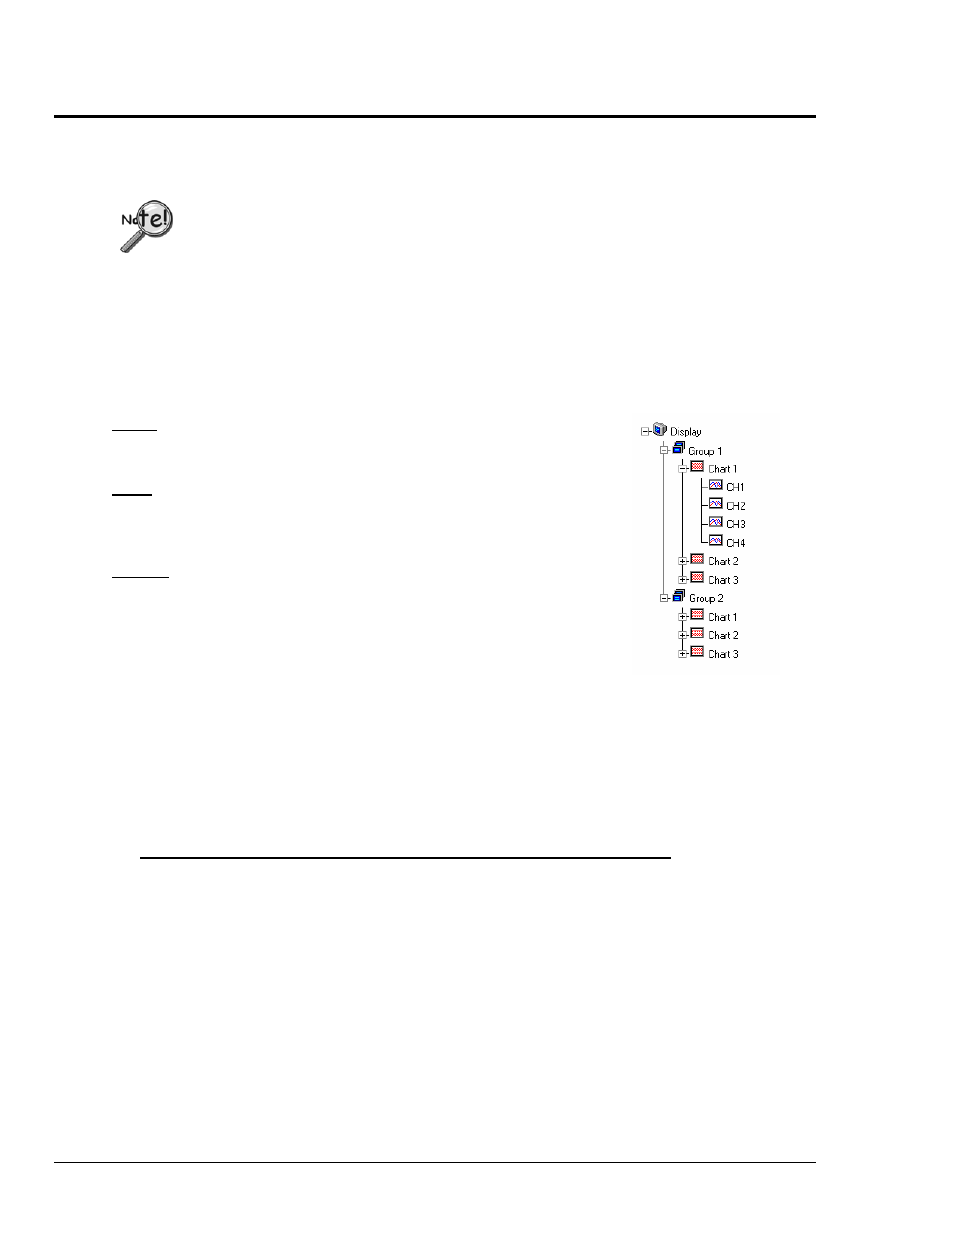
Group. “Group” refers to a group of charts. ChartView makes use of one chart
group. ChartView Plus allows up to 64 groups, depending on the capabilities of
your PC, but can only display one group at a time.
Chart. “Chart” refers to display area that reflects real-time channel data values
for a selected channel and can be scrolled at various rates. You can assign up to
16 charts per group. ChartView Plus enables each chart to display up to four
overlapping channels.
Channel. “Channel” refers to a signal channel. Channels will be displayed in
units of °C, °F, °K, °R, mV, V, or in user-defined units, depending on the
configuration and type of signal conditioning card used. With ChartView Plus
you can have up to 4 overlapping channels assigned to one chart.
Three Ways of Using ChartView
You can use ChartView to:
• chart and monitor specific channels with no acquisition of data to disk
• acquire data with no charting or meter use
• use charting and/or meters while acquiring data to disk
Chart channels (and/or monitor with meters) with no acquisition of data to disk (Acquisition State:
Waiting for Trigger) Prior to charting channels on ChartView’s Main Window, you need to configure
a display in regard to groups, charts, and channels. This aspect of configuration is performed through
Chart Setup Wizard (discussed in the following text), or through a Chart Setup window accessed
through the “Channel Configuration” button on ChartView’s Main Window.
In addition to charting channels, you can monitor selected channels via digital, analog, and/or bar
graph meters. Meter discussion begins on page CV-31 of this document. A detailed discussion of
configuring Meters begins on page CV-36.
Note: Only one group of charts can be viewed at a time.