Measurement Computing TempScan/1100 User Manual
Page 147
Software Reference
988992
ChartView , CV-15
Manually Creating a Display
For ChartView Plus users, if you plan to have a chart setup that is not weighted evenly, i.e., different
numbers of channels per chart and different numbers of charts per group, you may want to manually
setup your chart display from scratch, i.e., without beginning from a pre-existing display
configuration. This method is arrived at from the Chart Setup Wizard window by selecting “Manual
Chart Creation.” When this button is clicked, the program exits the Chart Setup Wizard and enters the
manual method of Display Configuration Setup. Although this method is referred to as “manual,” it
still contains some automatic elements, such as Automatically Add Groups to the Setup (available with
ChartView Plus).
Note: Even if an unevenly distributed chart display is desired, you can always edit a pre-existing
chart setup, or create a new setup by one of the Chart Setup Wizard’s automatic methods, and
then edit the setup.
To manually setup your chart display, using the “clean slate” approach, as opposed to “editing an
existing display,” perform the following steps.
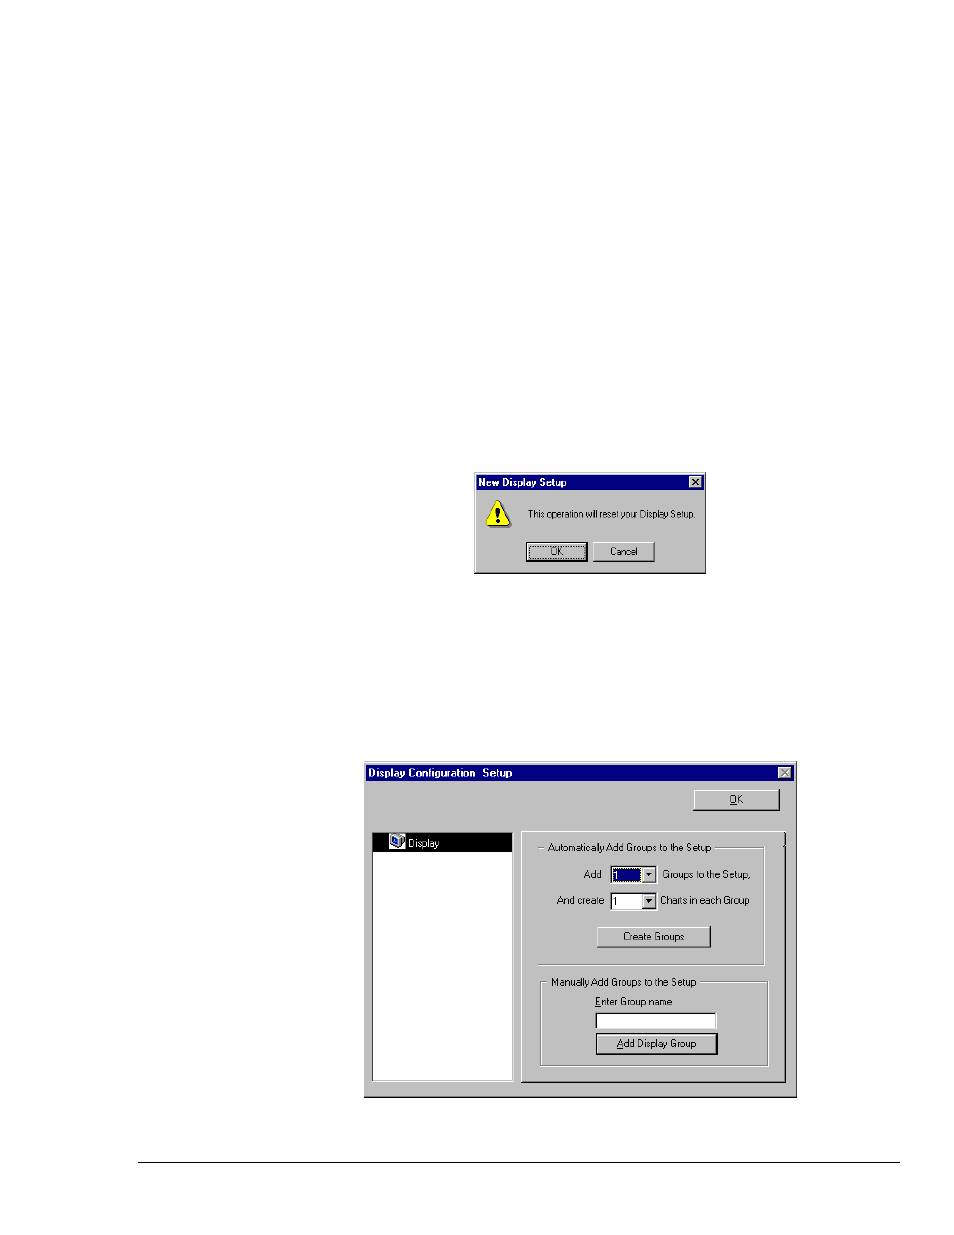
1. Select Wizard from the Chart pull-down menu of ChartView’s main window. The New Display
Setup dialog box appears.
2. Click OK on the New Display Setup dialog box. The Wizard setup window appears (see
following figure).
3. Click on the Manual Chart Creation button. The Display Configuration Setup box appears. Since
the previous display configuration was reset, no groups or charts are seen in the display area on
the left side of the screen.
Note: If you have ChartView Plus, you will be allowed to have more than one group, as well as
overlapping channels (up to four per chart). If you have the basic ChartView program,
you
will be limited to one group, and only one channel per chart.
Display Configuration Setup, The “Clean Slate” Approach