Eq transfer function, Channelstrip user guide – Metric Halo ChannelStrip 2 User Manual
Page 15
ChannelStrip User Guide
11
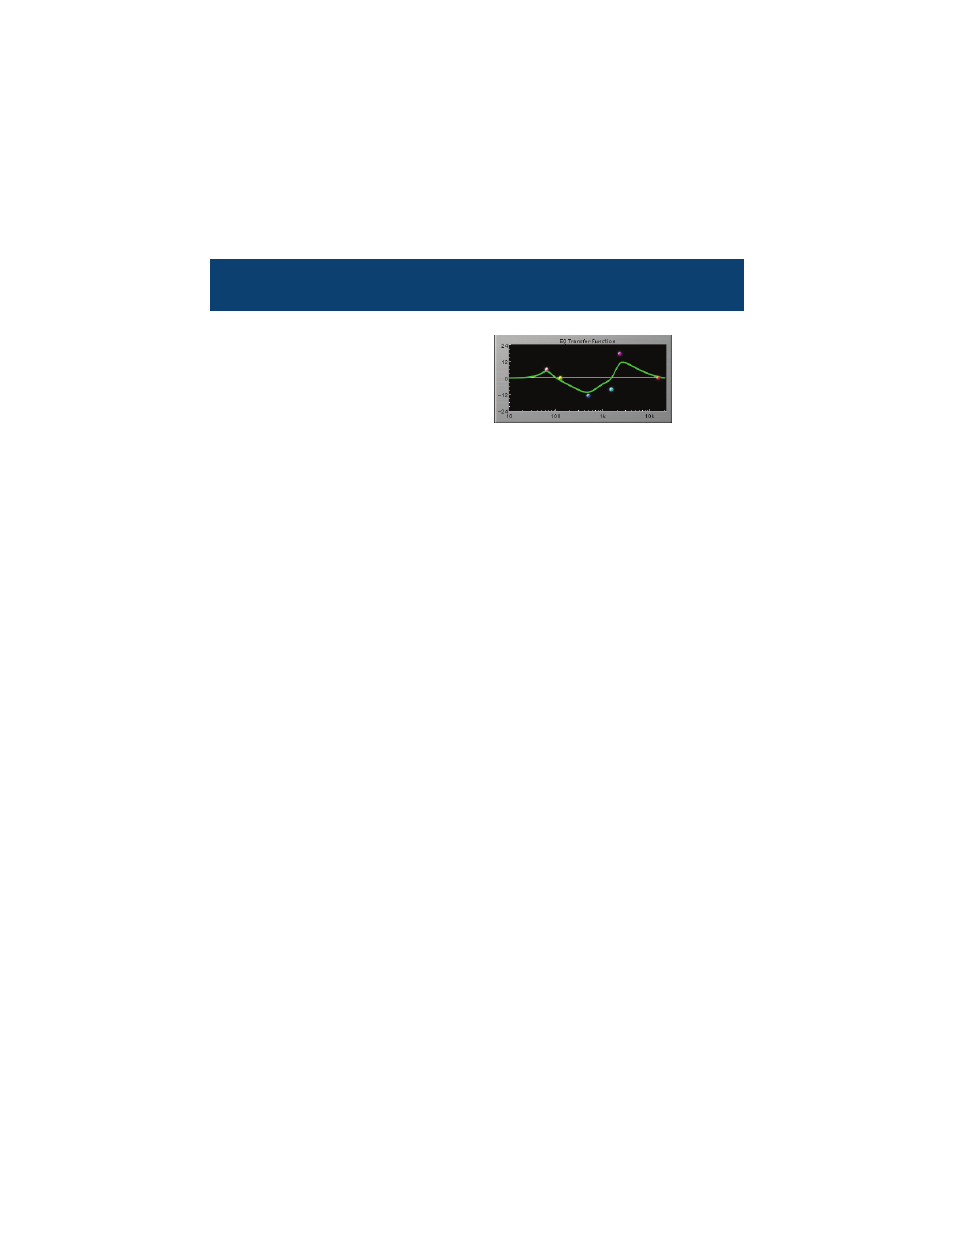
EQ
Transfer Function
The EQ transf
er function is a
combination of a visual repre-
sentation of how the EQ is
processing the signal and an
intuitive controller for the
associated filter bands. This
display is sometimes called a
“Cartesian Graph” by other EQ manufacturers.
The horizontal axis provides frequency calibration in Hertz (Hz).
The vertical axis provides level calibration in decibels (dBr). The
heavy green line indicates the relative change in level at each fre-
quency that is created by the combined effects of all of the active
bands in the equalizer. Each EQ band is represented by a colored
dot in the transfer function. The color of the dot matches the color
of the numeric readouts of the knobs for the corresponding EQ
band.
The band that is currently being edited will have a light gray cross-
hair centered under it. If the associated band is a parametric filter
there will also be two smaller colored dots that can be used to con-
trol the bandwidth of the filter. Clicking on a large colored dot and
dragging will allow you to adjust the frequency and gain of the asso-
ciated band. <command>–click the dot to toggle the band enable.
<option>–click the dot to adjust the bandwidth (dragging right
increases the bandwidth, left decreases the bandwidth). <com-
mand><option>–click the dot to switch the band filter type. Click
and drag the smaller dots associated with a larger dot to adjust the
filter bandwidth.
In order to increase the real-time performance of changing EQ
parameters, the transfer function graph switches to a lower resolu-
tion mode while you are changing parameter values. You may find
that the graph “jumps” slightly when you are editing narrow para-
metric filters.