Nortec OnLine GSTC User Manual
Page 16
Advertising
12 | Installation
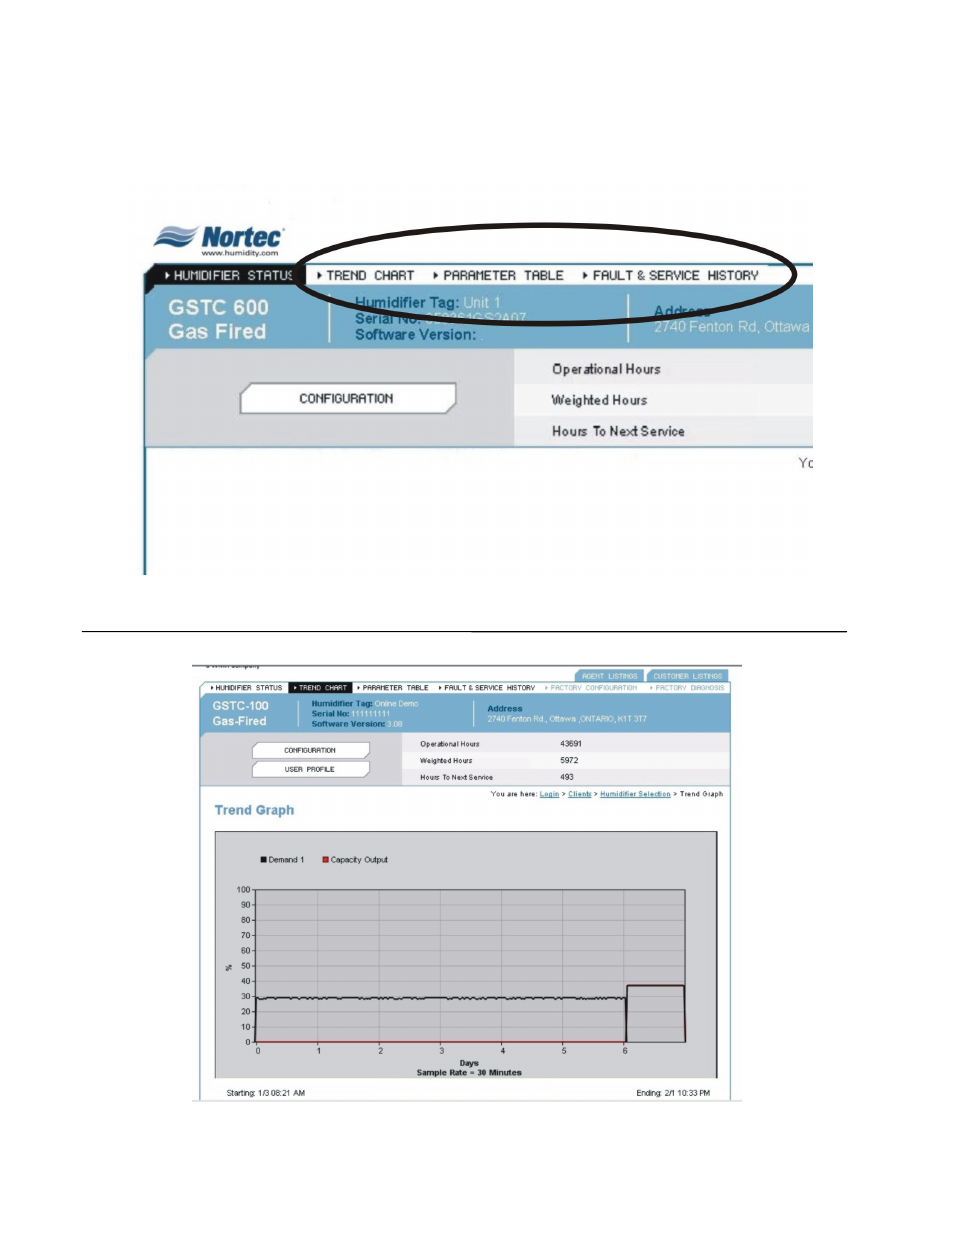
At the top of the screen the user is presented with options for three different screens, see
Figure 9. One option will provide a trending graph, see Figure 10, that monitors points such as
%RH/Demand and setpoint settings for channel 1 and channel 2 as well as the current
humidifier’s output. This trend graph is capable of keeping historical data for each particular
unit.
Figure 9: Three Screen Options
Figure 10: Trend Data
Advertising
This manual is related to the following products: