Casio ALGEBRA FX 2.0 PLUS Graphing User Manual
Page 55
Advertising
19990401
5-7-16
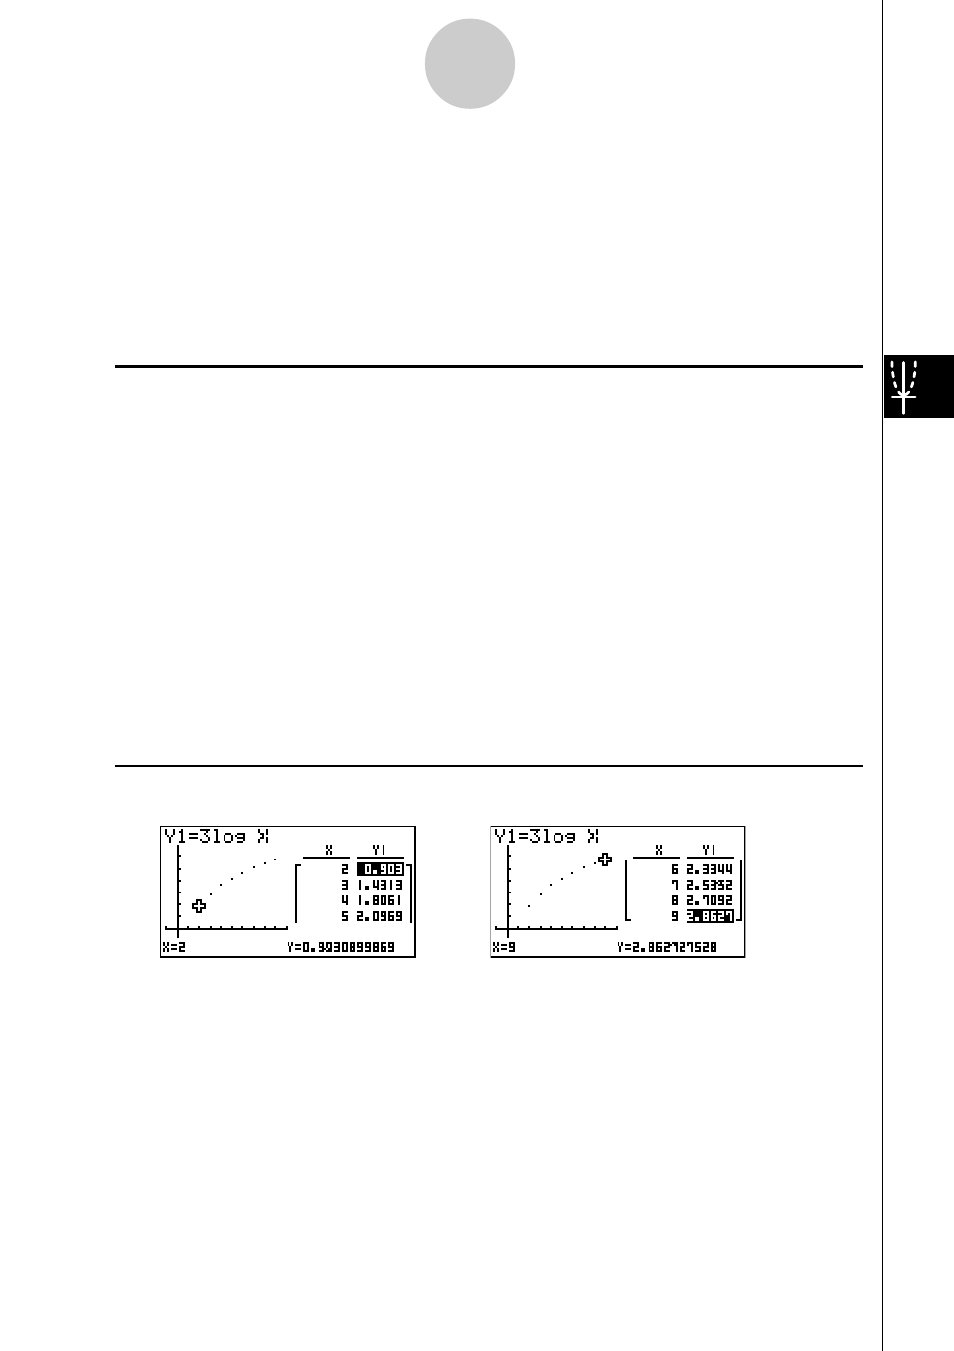
Using Tables
○ ○ ○ ○ ○
Example
Store the function Y1 = 3log
x
and simultaneously display its number
table and plot-type graph. Use a table range of 2 through 9, with an
increment of 1.
Use the following V-Window settings.
Xmin = –1,
Xmax = 10,
Xscale = 1
Ymin = –1,
Ymax = 4,
Yscale = 1
Procedure
1
m GRPH
•
TBL
2
!K(V-Window)-bwbawbwc
-bwewbwi
u3(SET UP)ccc1(T+G)i
3
3(TYPE)b(Y=)dlvw
6(g)2(RANG)
c
wjwbwi
4
5(TABL)
5(G
•
PLT)
5
6(g)4(G
•
Link)
6 c ~ c, f ~ f
Result Screen
…→
←…
Advertising
This manual is related to the following products: