Casio ALGEBRA FX 2.0 PLUS Graphing User Manual
Page 85
Advertising
19990401
○ ○ ○ ○ ○
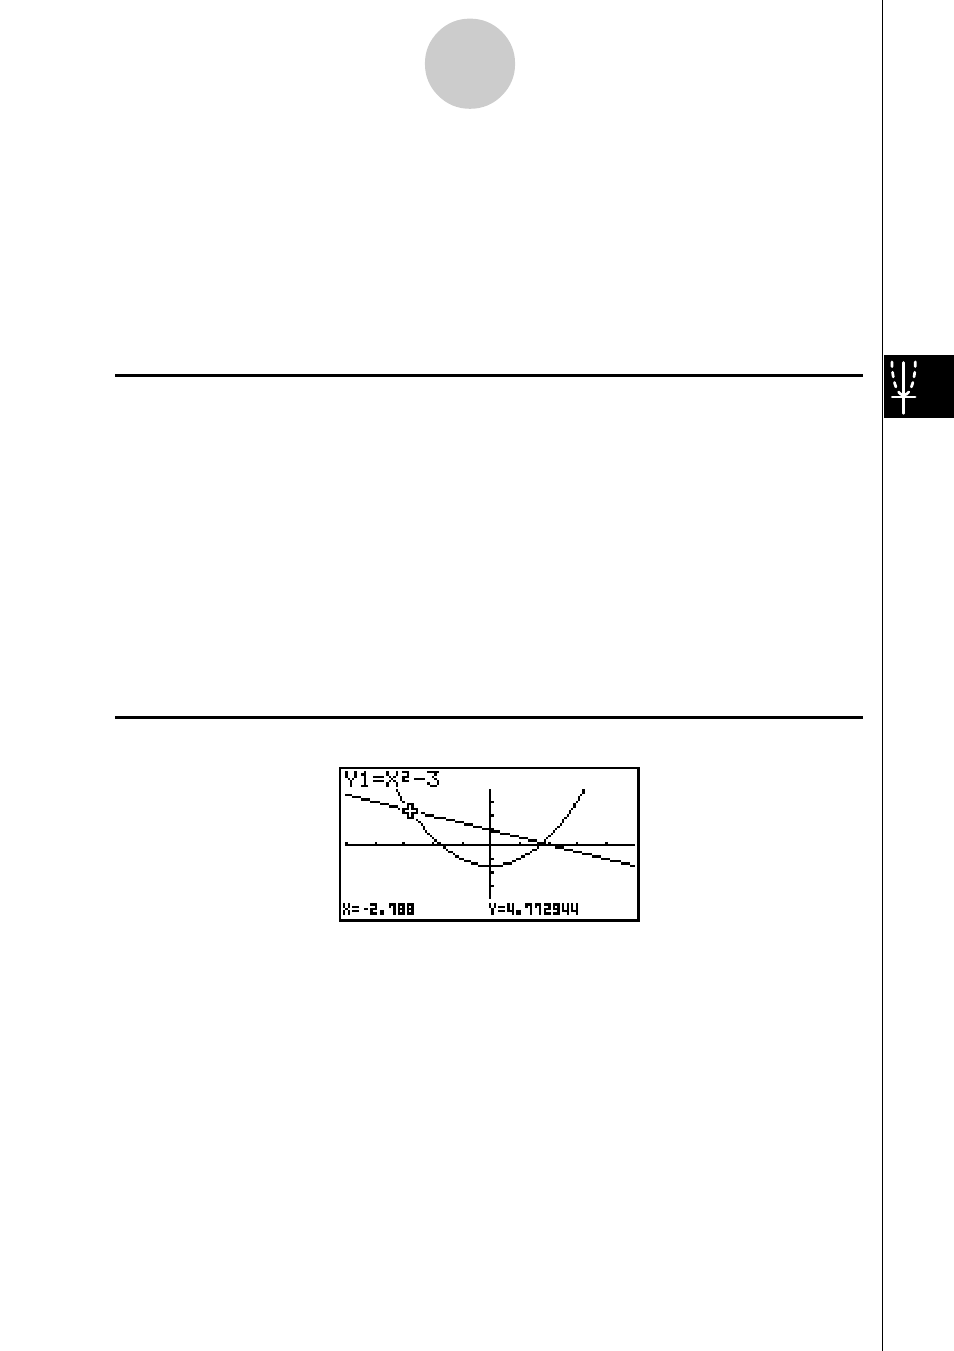
Example
Use coordinate rounding and display the coordinates in the vicinity of
the points of intersection for the two graphs produced by the
functions shown below.
Y1 =
x
2
– 3, Y2 = –
x
+ 2
Use the following V-Window settings.
Xmin = –5,
Xmax = 5,
Xscale = 1
Ymin = –10,
Ymax = 10,
Yscale = 2
Procedure
1
m GRPH
•
TBL
!K(V-Window) -fwfwbwc
-bawbawcwi
3(TYPE)b(Y=)vx-dw
-v+cw
5(DRAW)
2
2(ZOOM)i(Rnd)
3
1(TRACE)
d~d
Result Screen
5-11-8
Function Analysis
Advertising
This manual is related to the following products: