Procedure, Result screen – Casio ALGEBRA FX 2.0 PLUS Graphing User Manual
Page 79
Advertising
19990401
○ ○ ○ ○ ○
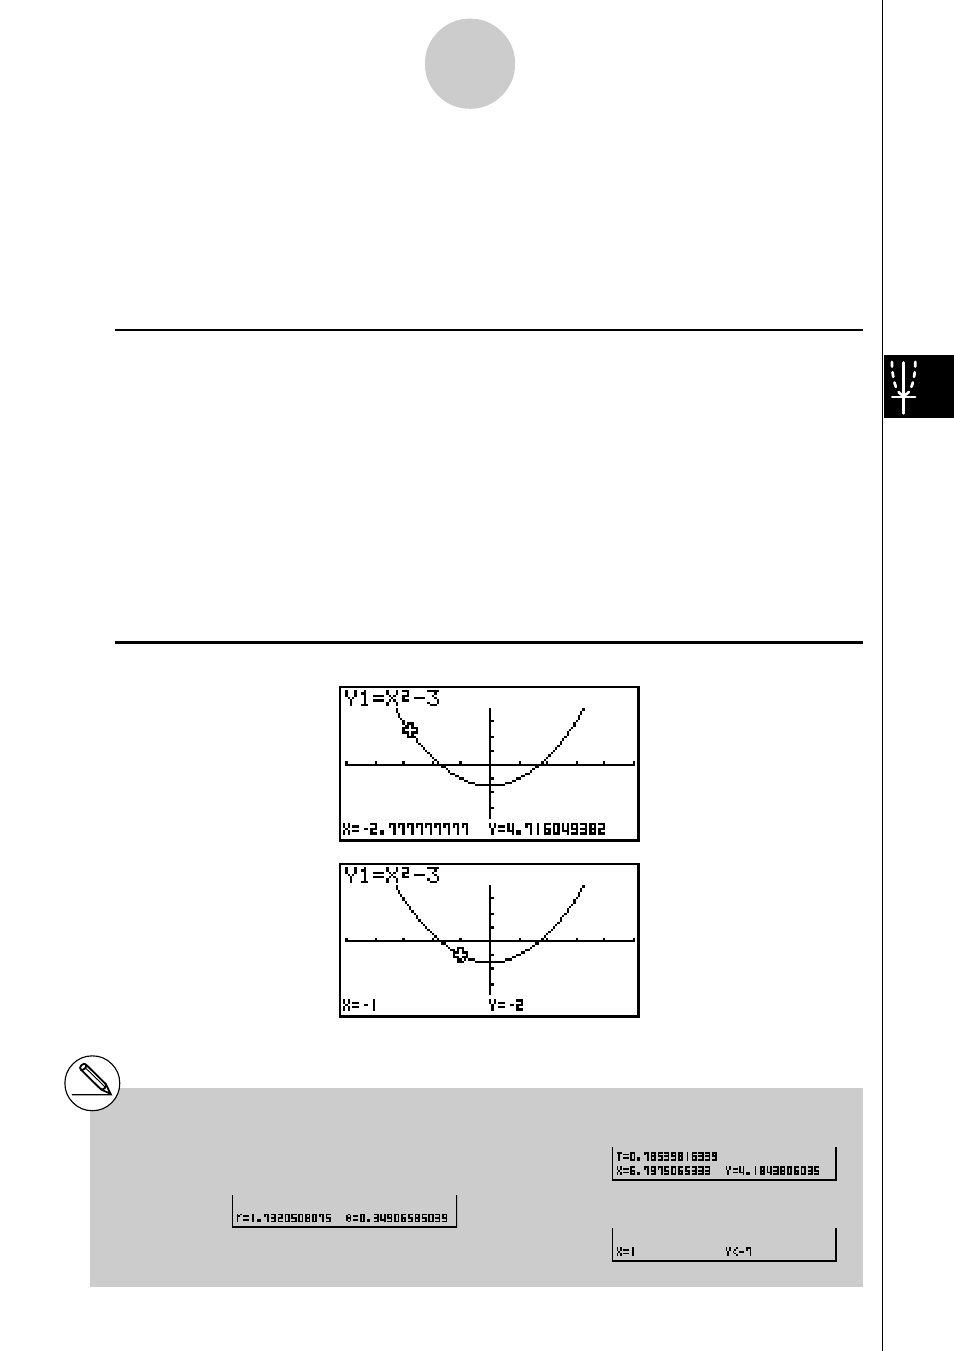
Example
Read coordinates along the graph of the function shown below.
Y1 =
x
2
– 3
Use the following V-Window settings.
Xmin = –5,
Xmax = 5,
Xscale = 1
Ymin = –10,
Ymax = 10,
Yscale = 2
Procedure
1
m GRPH
•
TBL
!K(V-Window) -fwfwbwc
-bawbawcwi
3(TYPE)b(Y=)vx-dw
5(DRAW)
2
1(TRACE)
3 d~d
4
-bw
Result Screen
5-11-2
Function Analysis
# The following shows how coordinates are
displayed for each function type.
• Polar Coordinate Graph
• Parametric Graph
• Inequality Graph
19991201
Advertising
This manual is related to the following products: