Casio ALGEBRA FX 2.0 PLUS Graphing User Manual
Page 83
Advertising
19990401
○ ○ ○ ○ ○
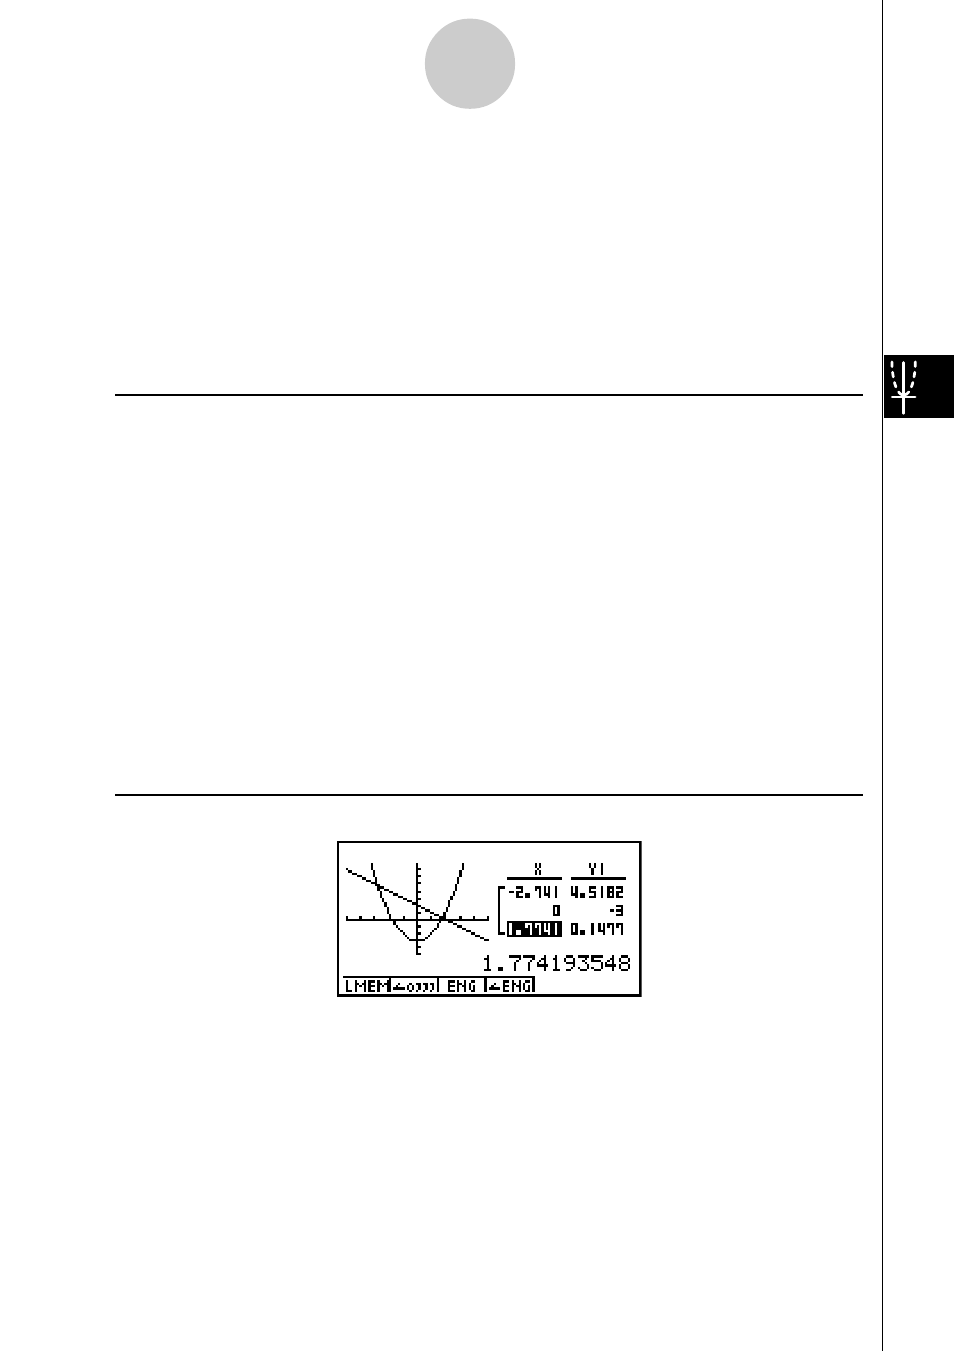
Example
Save, in a table, the coordinates in the vicinity of the points of
intersection at X = 0 for the two graphs shown below, and store the
table contents in List 1.
Y1 =
x
2
– 3, Y2 = –
x
+ 2
Use the following V-Window settings.
Xmin = –5,
Xmax = 5,
Xscale = 1
Ymin = –10,
Ymax = 10,
Yscale = 2
Procedure
1
m GRPH
•
TBL
2
u3(SET UP)ccc3(GtoT)i
3
!K(V-Window) -fwfwbwc
-bawbawcwi
4
3(TYPE)b(Y=) vx-dw
-v+cw
5(DRAW)
5
1(TRACE)
6 d~dwe~ewi
7
6(CHNG)
8
K1(LMEM)bw
Result Screen
5-11-6
Function Analysis
20011101
Advertising
This manual is related to the following products: