Casio ALGEBRA FX 2.0 PLUS Graphing User Manual
Page 73
Advertising
19990401
○ ○ ○ ○ ○
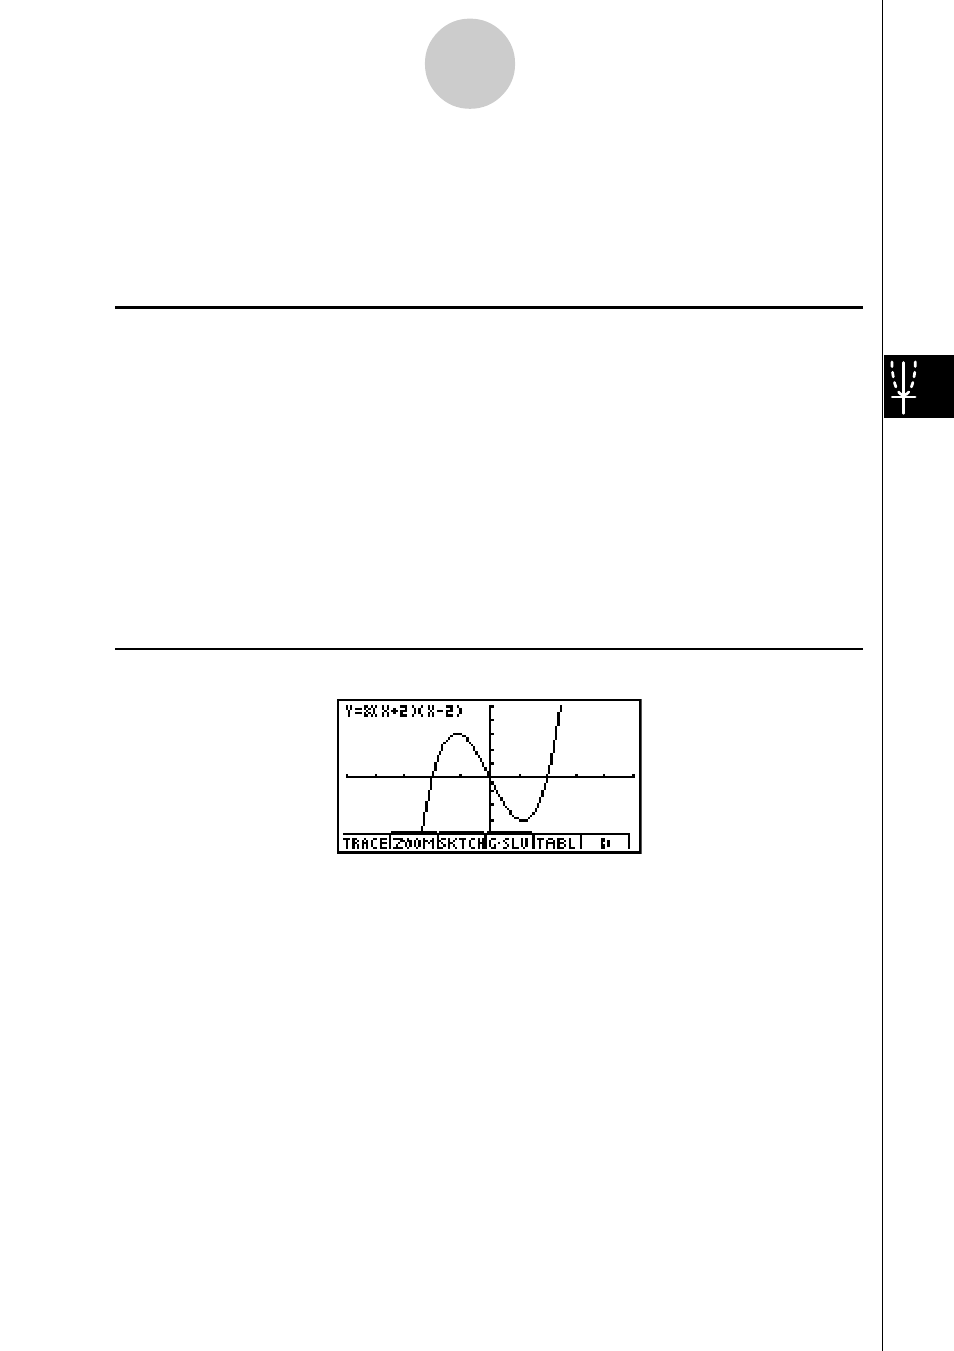
Example
Insert text into the graph
y
=
x
(
x
+ 2)(
x
– 2).
Use the following V-Window settings.
Xmin = –5,
Xmax = 5,
Xscale = 1
Ymin = –5,
Ymax = 5,
Yscale = 1
Procedure
1
m GRPH
•
TBL
!K(V-Window) -fwfwbwc
-fwfwbwi
3(TYPE)b(Y=)v(v+c)(v-c)w
5(DRAW)
2
3(SKTCH)e(Text)
3 f~f d~d
a-(Y)!.(=)v(v+c)(v-c)
i
Result Screen
5-10-4
Changing the Appearance of a Graph
19991201
Advertising
This manual is related to the following products: