Table 5–2 – Altera Stratix III User Manual
Page 20
5–2
Chapter 5: Power Measurement
Power Design Example
Stratix III Development Kit User Guide
© August 2008
Altera Corporation
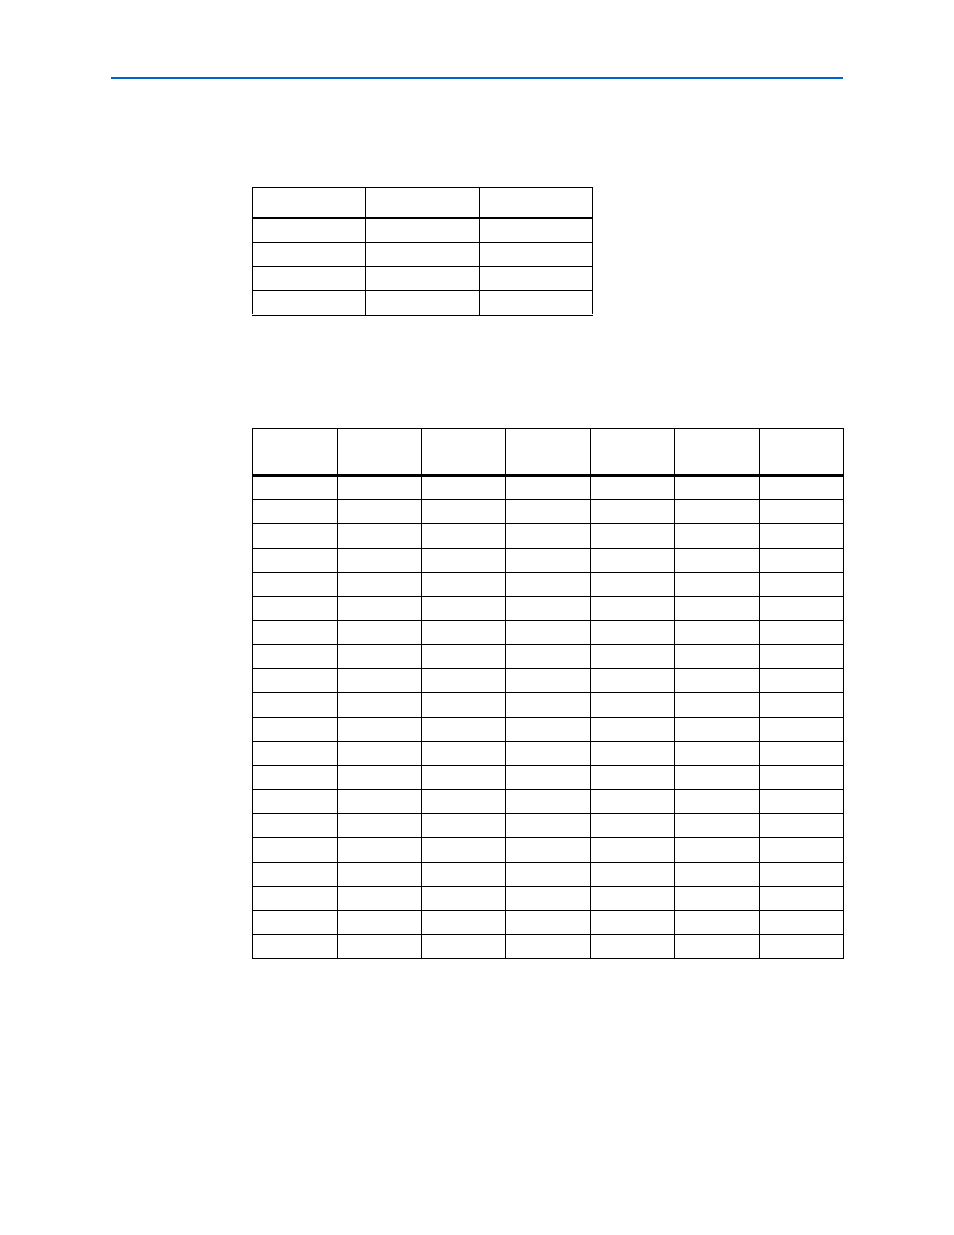
The LEDs in
indicate the power-state values of the design example as
User_PB1 advances frequency.
The LEDs in
indicate the power-state values of the design example (and
number of output pins, when enabled by User_PB3) as User_PB2 advances resource
utilization.
The resource state (
) controls the number of I/O pins used. Each resource
increment adds eight additional I/O pins (
). Similarly, the overall design
frequency (
) sets the toggle frequency of these I/O pins.
Table 5–2. Power State Indicators for Frequency
LED1 (C23)
LED0 (F21)
Frequency (MHz)
0
0
0
0
1
33
1
0
67
1
1
100
Table 5–3. Power State Indicators for Resources
LED6
(F19)
LED5
(C19)
LED4
(D19)
LED3
(A23)
LED2
(B23)
Resources
(%)
Number of
Outputs
0
0
0
0
0
5
8
0
0
0
0
1
10
16
0
0
0
1
0
15
24
0
0
0
1
1
20
32
0
0
1
0
0
25
40
0
0
1
0
1
30
48
0
0
1
1
0
35
56
0
0
1
1
1
40
64
0
1
0
0
0
45
72
0
1
0
0
1
50
80
0
1
0
1
0
55
88
0
1
0
1
1
60
96
0
1
1
0
0
65
104
0
1
1
0
1
70
112
0
1
1
1
0
75
120
0
1
1
1
1
80
128
1
0
0
0
0
85
136
1
0
0
0
1
90
144
1
0
0
1
0
95
152
1
0
0
1
1
100
160