Typical performance graphs – Linx Technologies TRM-xxx-NT User Manual
Page 6
– –
– –
6
7
10
15
20
25
30
35
40
-20
-15
-10
-5
0
5
10
15
Icc
(m
A)
TX Output Power (dBm)
-40°C
+25°C
+85°C
10
15
20
25
30
35
40
-20
-15
-10
-5
0
5
10
15
Icc
(m
A)
TX Output Power (dBm)
-40°C
+25°C
+85°C
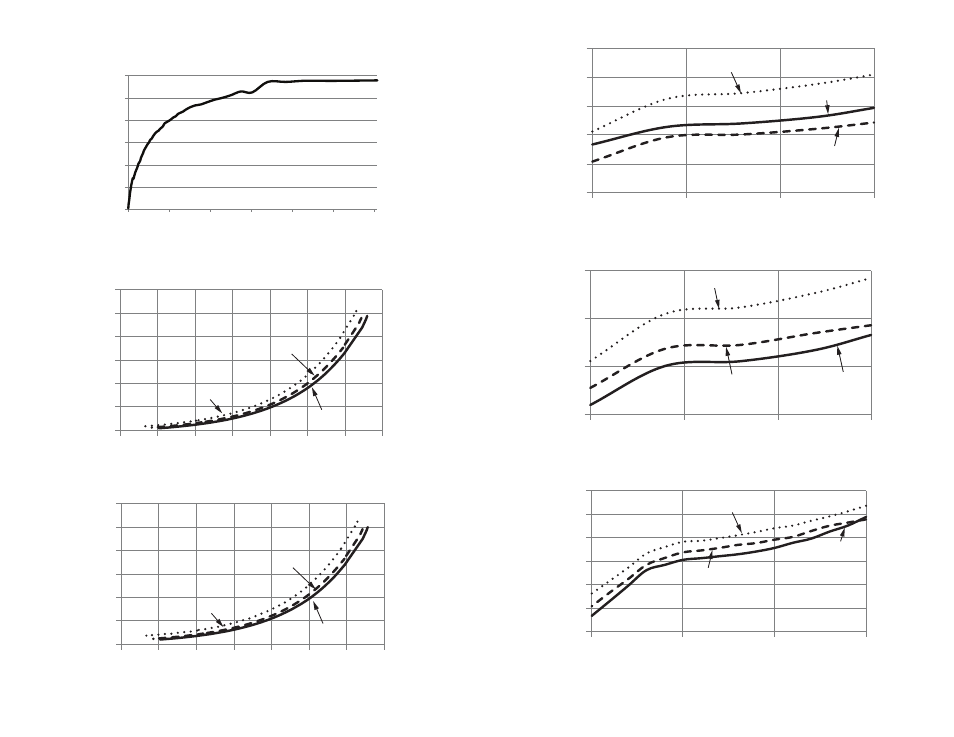
Typical Performance Graphs
TX
Output
Po
wer
(d
Bm
)
LVL_ADJ Resistance (k
Ω)
-17
-12
-7
-2
3
8
13
0
150
300
450
600
750
900
32
33
34
35
36
37
2.5
3.5
4.5
5.5
TX
Icc
(m
A)
Supply Voltage (V)
-40°C
+25°C
+85°C
16
17
18
19
20
21
22
2.5
3.5
4.5
5.5
RX I
cc
(m
A)
Supply Voltage (V)
-40°C
+25°C
+85°C
14
15
16
17
2.5
3.5
4.5
5.5
TX
Icc
(m
A)
Supply Voltage (V)
-40°C
+25°C
+85°C
Figure 5: NT Series Transceiver Output Power vs. LVL_ADJ Resistance
Figure 6: NT Series Transceiver Current Consumption vs. Transmitter Output Power at 3.3V
Figure 7: NT Series Transceiver Current Consumption vs. Transmitter Output Power at 5.5V
Figure 8: NT Series Transceiver TX Current Consumption vs. Supply Voltage at +12.5dBm
Figure 9: NT Series Transceiver TX Current Consumption vs. Supply Voltage at 0dBm
Figure 10: NT Series Transceiver RX Current Consumption vs. Supply Voltage