Section 6: creating reports, 1 in-game reports, 2 spray chart printouts – Daktronics DakStats Baseball Software User Manual
Page 37: Section 6, Creating reports, In-game reports, Spray chart printouts
Creating Reports
31
Section 6:
Creating Reports
DakStats Baseball allows users to view and print a wide variety of reports to help assess player and
team statistics. The reports are produced as HTML files for easy transferring and emailing.
6.1 In-Game Reports
Users are able to print game reports when a game
is finished or while it is still open.
Note: By “print” it is meant that the reports
are generated as HTML files that can be
opened in an Internet browser and then sent
to a printer.
To print in-game reports:
1. Go to File > Print In Game.
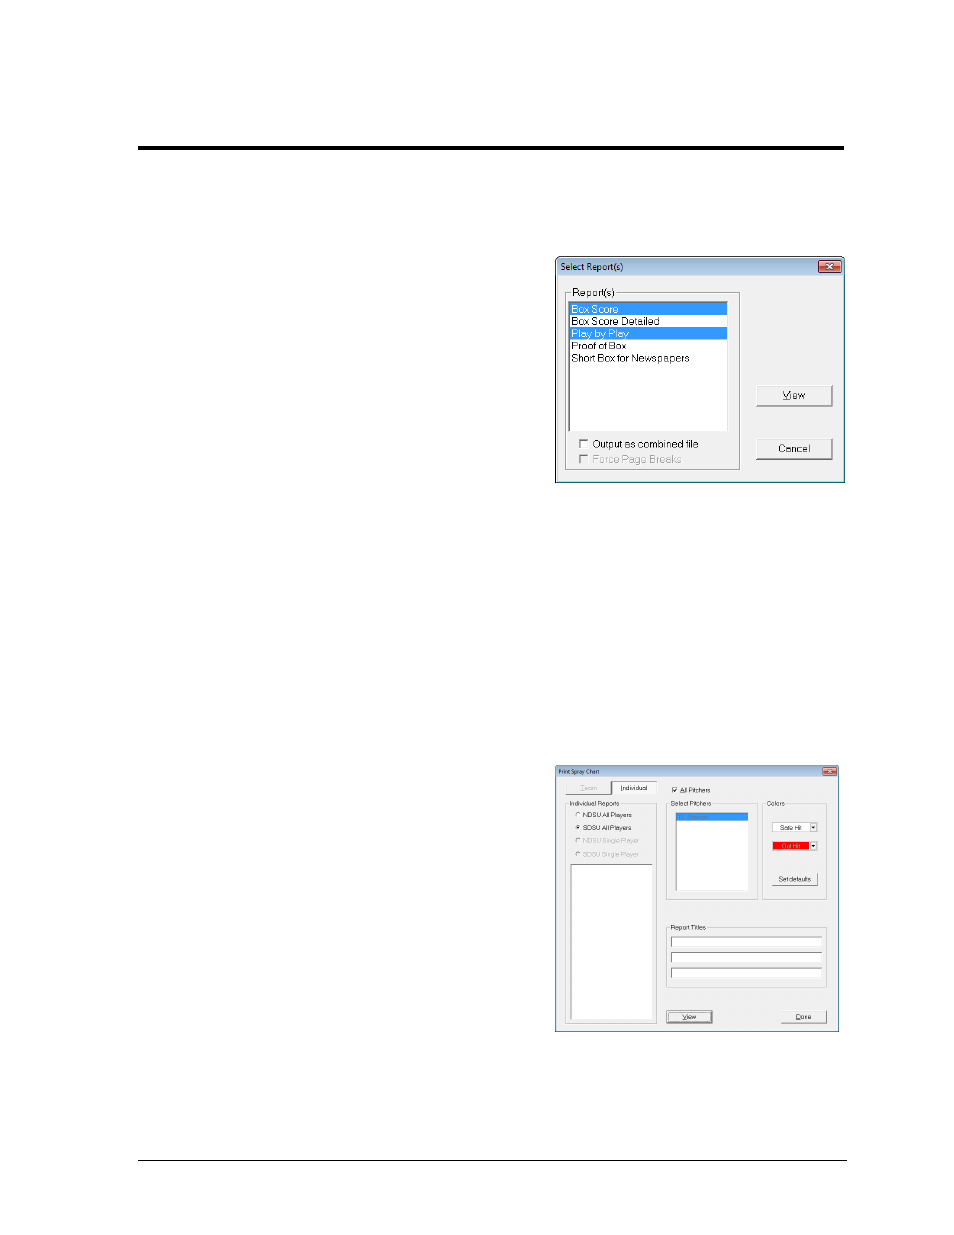
2. In the Select Report(s) window (Figure 42),
check one or more of the report types.
3. Selecting Output as combined file will show all reports on a single page. Combined
reports will also have links back to the top of the page under each section. Enable
Force Page Breaks to ensure each report appears on its own sheet of paper when
printed out.
4. Click View to open the report(s) in the default Internet browser, or click Cancel to
avoid creating the report(s).
5. Typically, going to File > Print within the Internet browser will create a hardcopy
printout of the report.
6.2 Spray Chart Printouts
Users are able to print spray charts for each batter
on one or both teams (Play-by-play mode only).
To print a spray chart:
1. Go to File > Print Spray Chart.
2. In the Print Spray Chart window (Figure
43), select which team’s report to print.
3. Click on the pitcher name(s) to print.
Clicking again will deselect. Check the
All Pitchers checkbox to select every
pitcher for the team.
4. Select the Safe Hit and Out Hit colors if
desired. Click Set defaults to reset.
5. Enter descriptive Report Titles.
6. Click View to open the spray charts in
the default Internet browser.
7. Typically, going to File > Print within the Internet browser will create a hardcopy
printout of the report.
8. Click Done when finished.
Figure 42: Select Report(s)
Figure 43: Print Spray Chart