Genee World Virtual G Pad User Manual
Page 40
40
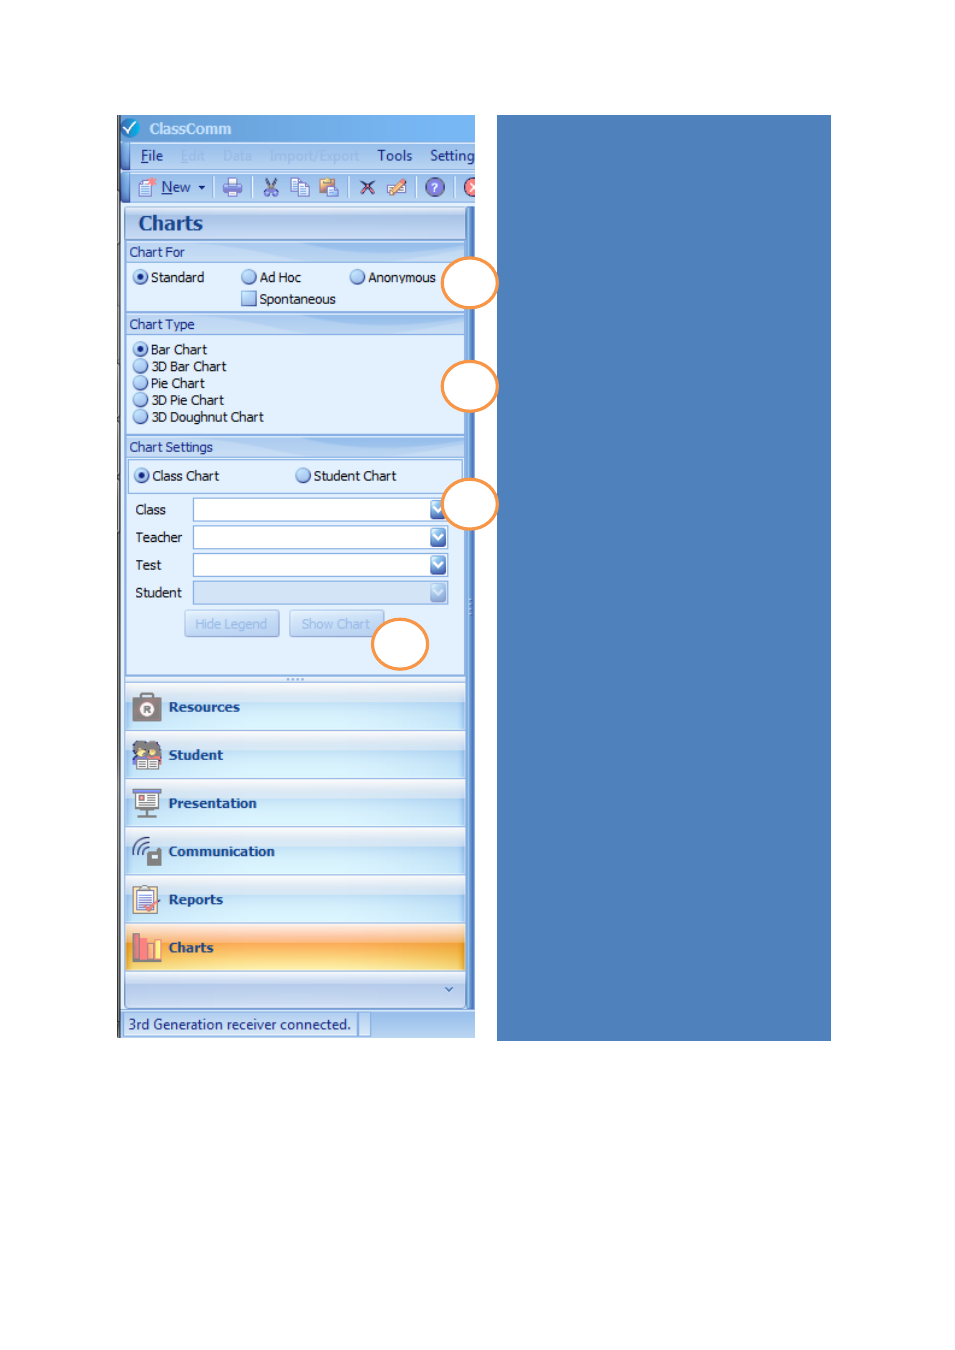
CHART SETTINGS
From the chart settings panel, you can select
the presentation and report type for any
saved record assessment presentations.
1 – “Chart For” From here select whether
the chart you wish to view is from a
Standard (existing class) presentation, Ad
Hoc class presentation or Anonymous Class
Presentation. Under each of these class
types, it is possible to perform a
spontaneous presentation. If it is a
spontaneous presentation chart you wish to
view, select the Class type from standard, Ad
hoc, anonymous and then check the
spontaneous box as well.
2 – “Chart Type” – Currently ClassComm
offers 5 charts as shown. Simply check the
option for the chart you wish to view.
3 – “Chart Settings” - Firstly select either a
Class Chart or Student Chart. Then select
the Class, Teacher and Test from the drop-
down boxes. .
4 – Once the above options have been
selected, click “Show Chart” to view the
chart.
1
2
3
4