4 barometer mode, 5 barometer mode, 6 barometer mode – La Crosse Technology K2-100 User Manual
Page 10: 3 barometer mode
GB
GB
GB
GB
hold
adjust
Calibration Sequence
( Calibrate the Pressure from 1013.8 to 1019.8 mb)
increment
the pressure
mode
button
Barometric Pressure
Graph Display
Decrement
the pressure
digits have
been selected
(flashing)
start/stop
lap/reset
hold
adjust
Before Calibrate the Barometer
- The K2-100 was calibrated for you in the factory. For normal
use, you need not to calibrate the Barometer. But for vigorous
users, a calibration procedure has been build in the K2-100.
-
B e f o r e c a l i b r a t e t h e B a r o m e t e r, y o u m u s t h a v e t h e
ambient barometric pressure, because that pressure value
h a s t o b e i n p u t i n t o t h e K 2 - 1 0 0 d u r i n g t h e c a l i b r a t i o n
procedure.
- You may call up the observatory station at the nearest
location from your current position to get the ambient
barometric pressure.
Important: Inputing an incorrect pressure in the calibration
procedure will result in a mistaken pressure reading in the future.
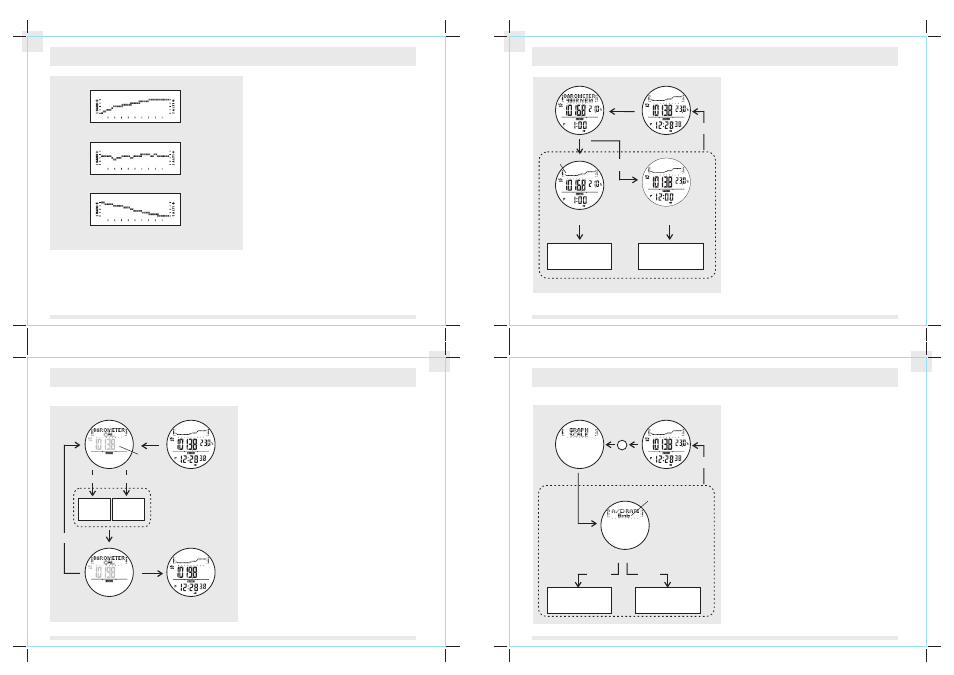
Pressure Calibration Procedures
-
Press and hold the [adjust] button for 2 seconds to change
the display from the Pressure Graph Display to Barometric
Pressure Calibration Display.
-
The digits of the middle row of the display and the barometric
pressure unit start flashing because it is selected.
-
Press the [start/stop] button to increase the number; press
the [lap/reset] button to decrease the number. Hold down the
button to change the number at a higher speed.
-
If you select a wrong barometric pressure unintentionally,
press and hold the [adjust] button for 3 seconds to restore
the setting to the absolute pressure value.
-
After you set the barometric pressure, press the [mode]
button to exit the setting and return to Barometric Pressure
Graph Display.
- If no button is pressed in the setting display for about 3
minutes, the K2-100 will return to the Barometric Pressure
Graph Display.
6.4 Barometer Mode
- Calibrate the Barometer
33
35
34
36
Barometric Pressure
Graph Display
adjust
button
flashing
dot
flashing
dot
48 Hour Memory Display
( the newest memory)
48 Hour Memory Display
(the oldest memory)
6.5 Barometer Mode
- 48 Hour Memory
48 Hour Memory
- T h e K 2 - 1 0 0 h a s a b u i l t - i n m e m o r y f u n c t i o n : the 48
Hour Memory.
-
48 Hour Memory records the Barometric Pressure for
every one hour of the last 48 hours.
-
These memories can be reviewed in
the 48 Hour Memory
Display.
Review the 48 Hour Memory
-
Press the [adjust] button to select the 48 Hour Memory
Display in the Barometric Pressure Graph Display.
-
The 'BAROMETER 48 HR MEM' will slide out and display
for 3 seconds, the 'MEM' indicator will be shown also.
- The Barometric Pressure 48 hour history graph shows
on the 1st row of the display.
-
T h e p r e s s u r e m e m o r y a n d te m p e r a t u r e s h o w o n
the 2nd row of the display.
- The time which recorded the memory shows on the 3rd
row of the display.
-
Press the [lap/reset] button to view the memory through
b a c k w a r d s c r o l l i n g ( f r o m - 1 t o - 4 8 h o u r ) , p r e s s t h e
[start/stop] button to view
the memory through forward
scrolling ( from -48 to -1 hour).
NOTE:
-
T h e m e m o r y c o l u m n s o n t h e l e f t h a n d s i d e o f t h e
history graph are recorded earlier than those on the right.
start/stop
lap/reset
To view the memory
by forward scrolling
(from -48 to -1
)
hour
To view the memory
by backward scrolling
(from -1 to -48 hour)
lap/reset
button
mode
button
Barometric Pressure
Graph Display
adjust
button
6.6 Barometer Mode
- Ascending / Descending Rate of the 48 Hour Memory
Ascending and Descending Rate
- The K2-100 a has built-in a function for calculating the
a s c e n d i n g a n d d e s c e n d i n g r a t e o f t h e B a r o m e t r i c
Pressure of the last 48 hours.
-
These figures can be reviewed in the Ascending Rate
Display and the Descending Rate Display.
Review the Ascending and Descending Rate
-
P r e s s t h e [ a d j u s t ] b u t t o n t h r e e t i m e s t o s e l e c t t h e
Ascending / Descending Rate Display in the Barometric
Pressure Graph Display.
-
While the Ascending / Descending Rate Display is shown,
the Barometric Pressure Ascending or Descending Rate
shows on the 1st row of the display.
-
A (+) value implies ascending rate; a (-) value implies a
descending rate.
-
The pressure memory and the temperature sho
w on the
2nd row of the display.
- The time which this memory was recorded shows on the
3rd row of the display.
-
P r e s s t h e [ l a p / r e s e t ] b u t t o n t o v i e w t h e m e m o r y b y
backward scrolling ( from -1 to 48 hour), press the
[start/stop] button to view the memory through forward
scrolling (from -48 to -1 hour).
- While these displays are shown, press the [mode] button
t o e x i t t h e r e v i e w i n g a n d t h e d i s p l a y w i l l r e t u r n
to the Barometric Pressure Graph Display.
lap/reset
To view the memory
by forward scrolling
(from -48 to -1
)
hour
To view the memory
by backward scrolling
(from -1 to -48 hour)
mode
button
adjust
button
adjust
button
start/stop
ascending or
descending rate
Ascending / Descending
Rate Display
Implication of the Pressure History Graph
-
In general, a rise trend in the Pressure History Graph
may forecast good weather ahead.
-
A steady trend in the Pressure History Graph has the
possibility to have steady weather ahead.
- A falling trend in the Pressure History Graph may
predict bad weather ahead.
I M P O R T A N T : T o g e t a n a c c u r a t e r e s u l t o f t h e w e a t h e r
forecast, the user has to stay at the same altitude for over
48 hours.
Rise Trend
Steady Trend
Fall Trend
Pressure History Graph
6.3 Barometer Mode -
Implication of the Barometric Pressure History Graph
32
33
34
35