0 barometer and its sub-displays, 0 barometer mode and its sub-displays – La Crosse Technology K2-100 User Manual
Page 9
GB
GB
GB
GB
29
30
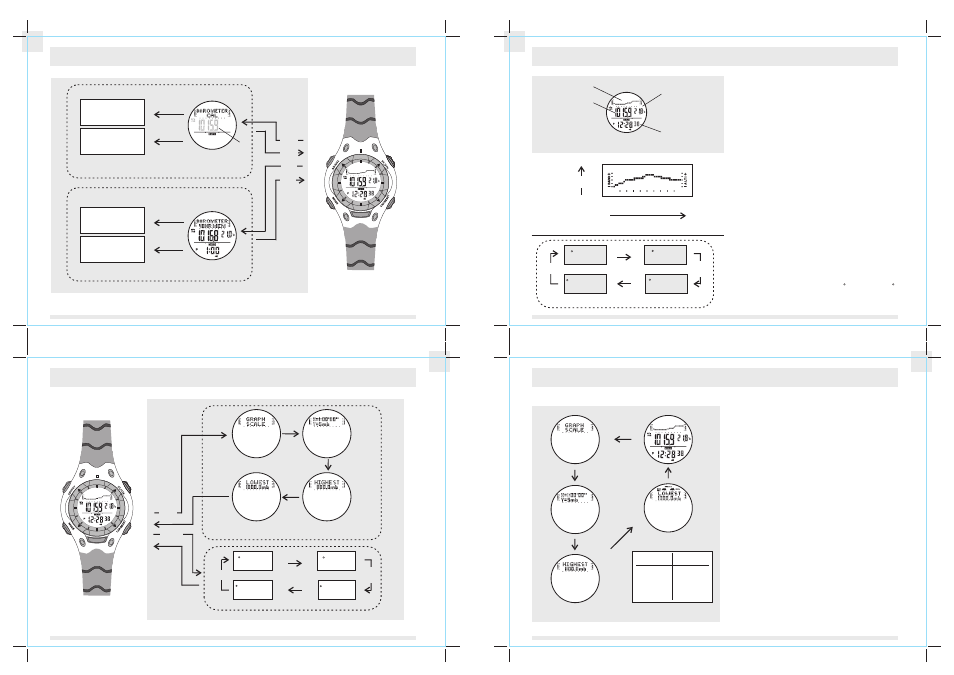
6.1 Barometer Mode
- Barometric Pressure Graph Display
Barometric Pressure
Graph Display
Temperature
in degree Celsius
Barometric
Pressure
Barometric Pressure
History Graph
Real time
C (Celsius)
hPa/mb
C (Celsius)
inHg
F(Fahrenheit)
inHg
F (Fahrenheit)
hPa/mb
hold
lap/reset
hold
lap/reset
hold
lap/reset
hold
lap/reset
Unit Selection Sequence
Barometric Pressure Graph Display
-
In the Barometric Pressure Graph Display, the 1st row of
the display shows the pressure history graph of the last
48 hours.
T h e 2 n d r o w o f t h e d i s p l a y s h o w s t h e B a r o m e t r i c
Pressure and the current temperature.
-
The 3rd row of the display shows the current time:
hour
minute and second.
The Barometric Pressure History Graph
- T h e K 2 - 1 0 0 s t o r e s t h e B a r o m e t r i c p r e s s u r e v a l u e s
a u t o m a t i c a l l y a s t h e t i m e g o b y .
The Barometric Pressure history graph of the Barometric
Graph Display is plotted on these pressure values.
-
-
The X-axis of the history graph is time variable; the Y-
axis of the history graph is barometric pressure variable.
The Barometric Pressure History Graph is made up
of 11 rows and 40 columns.
-
T h e m e m o r y c o l u m n s o n t h e l e f t h a n d s i d e o f t h e
history graph are recorded earlier than those on the right.
-
The scale of the history graph is changeable, the scale
will be changed in order to fit in the Barometric Pressure
values. Check the 'Barometric Pressure History Graph
Scale' section for more detail on the scale of the history
graph.
To Switch among Units
- The K2-100 can display pressure in millibar (mb) hecto
-
Press and hold the [lap/reset] button to change the units
as in the units select sequence.
p a s c a l ( h P a ) o r i n c h m e r c u r y ( i n H g ) ; t h e K 2 - 1 0 0
can display temperature in Celsius ( C) or Fahrenheit ( F).
C (Celsius)
hPa(mb)
C (Celsius)
inHg
F(Fahrenheit)
inHg
F (Fahrenheit)
hPa(mb)
hold
lap/reset
hold
lap/reset
hold
lap/reset
hold
lap/reset
Unit Selection Sequence
hold
lap/reset
lap/reset
button
Graph Scale Display
6.0 Barometer and its sub-displays ...
continue
Barometric Graph Display
31
32
6.2 Barometer Mode
- Pressure History Graph Scale
Pressure History Graph Scale
-
T h e s c a l e o f t h e Y - a x i s o f t h e H i s t o r y G r a p h i s
changeable for fitting all t he pressure memory into the
graph.
-
Press the [lap/reset] button once to view t he pressure
s c a l e i n f o r m a t i o n , i n t h e B ar o m e t r i c P r e s s u r e G r a p h
Display,
-
The 'GRAPH SCALE' message will slide out and display
for 3 seconds, then the X-axis and Y-axis resolutions
will be shown.
-
For example, 'X=1:00'00"' implies that the resolution of
X-axis is 1 hour per column; at the same time, 'Y=0.5mb'
implies that the resolution of Y-axis is 0.5 millibar per
row.
-
T h e h i g h e s t a n d t h e l o w e s t a l t i t u d e s o f t h e H i s t o r y
Graph will be shown on the display a while later .
-
F o r e x a m p l e , 'H I G H E S T 1 1 0 0 . 0 m b' i m p l i e s t h a t t h e
current maximum pressure of the Pressure History Graph
is 1100.0 millibar. 'LOWEST 1000.0m' implies that the
m i n i m u m p r e s s u r e o f t h e P r e s su r e H i s t o r y G r a p h i s
1000.0 millibar.
NOTE:
-
T h e r e s o l u t i o n o f X - a x i s o f t h e h i s t o r y g r a p h ( t i m e
variable) is fixed as 1 hour.
-
The resolution of Y-axis of the history graph ( barometric
pressure variable) is ranging from 0.1, 0.2, 0.5, 1, 2, 5,
10, 20, 50, 100, 200 and 300 millibar.
Pressure
Graph Display
lap/reset
button
History Graph Scale Display
Barometric Pressure
History Graph
the pressure
variable
(Y-axis)
the time variable
(X-axis)
pressure
total display time
(1 hour X 40 column=40 hour)
total display pressure
(Y axis resolution X 11 row)
Y-axis
resolution
0.1, 0.2, 0.5
1, 2, 5
10, 20, 50
100, 200, 300
millibar(s)
X-axis
resolution
1 hour
48 Hour Memory Display
Barometric Calibration Sequence
Barometric Graph Display
adjust
button
mode
button
hold
adjust
mode
button
To view the memory
by forward scrolling
(from -48 to -1
)
hour
To view the memory
by backward scrolling
(from -1 to -48 hour)
start/stop
start/stop
lap/reset
lap/reset
Increment the
Barometric Pressure
Decrement the
Barometric Pressure
flashing
digits
6.0 Barometer Mode and its sub-displays
28
29
30
31
60
15
30
45
60
15
30
45