La Crosse Technology WS-9119U User Manual
Page 16
16
AIR PRESSURE
The 5
th
and 6
th
sections of the sections of the LCD show the relative air pressure and the air pressure history.
The reference relative air pressure can be set between 28.35 to 30.72 inHg (960 to 1040hPa). See “Relative pressure
value setting” in manual setting.
BAR GRAPH DISPLAY
Depending on programming conditions, display of the history of air pressure in form of a graph consisting of vertical
bars.
AIR PRESSURE HISTORY
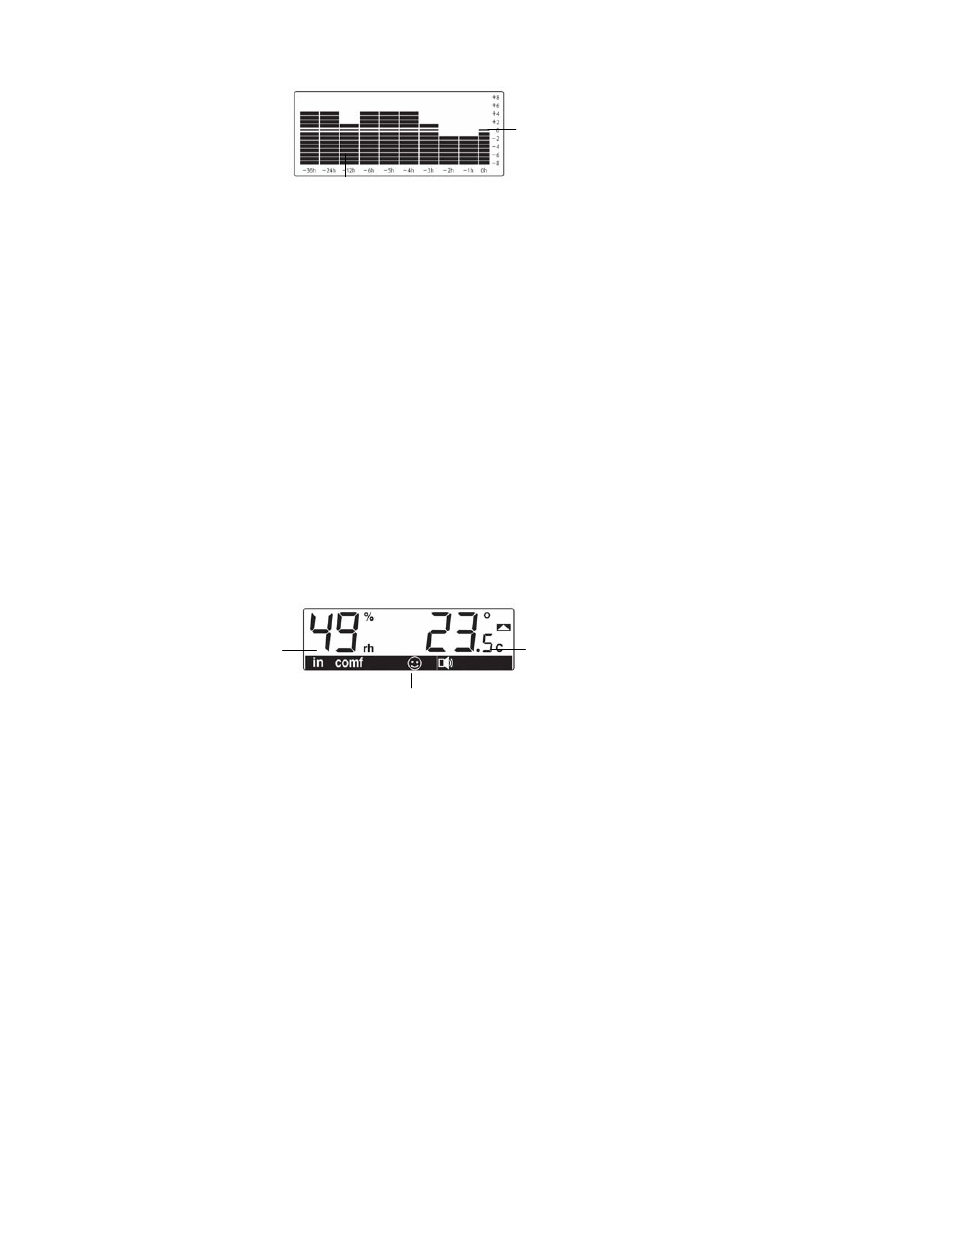
The bar graph of the electronic barometer shows the air pressure history of the past 36 hours in 17 steps.
The horizontal axis represents the last 36 hours air pressure recording (-36, -24, -12, -6, -5, -4, -3, -2, -1, and 0 hour).
The bars are plotted at each of the 17 steps and give the trend over the recorded period. The scale on the right
compares the result. The
″0″ in the middle of this scale determines the current air pressure.
The vertical axis represents the air pressure changes in inHg (+8, +6, +4, +2, 0, -2, -4, -8. “0” represents the current air
pressure). Each change (±1, ±2, ±3, ±4, ±5, ±6, ±7,
±8; the odd values are not shown on the vertical axis but can be
determined) shows in inches of mercury (inHg), how high or low the past air pressure was as compared to the current
one. If the bars are rising it indicates that the weather is getting better due to an increase in air pressure. If the bars go
down it indicates a drop of the air pressure and the weather is expected to get worse from the present time
″0″.
At every full hour the current air pressure is used as a basis for the display of a new graph bar. The existing graph is
then moved one bar to the left.
Note:
For accurate barometric pressure trend, the intelligent weather station should operate at the same altitude. For
example, it should not be move from the ground to the second floor of the house. Should the unit be moved to a new
location, discard readings for the next 12 – 36 hours.
INDOOR RELATIVE HUMIDITY AND INDOOR TEMPERATURE:
The indoor temperature and humidity data are automatically updated and displayed on the third of the LCD.
Indoor relative
humidity in %
Indoor temperature
in °F or ºC
Indoor comfort indicator
Air pressure over the last 12 hours
Air pressure changes
in hPa