Super Systems 9120 RPSC User Manual
Page 17
Model 9120 Redundant Probe System - Color
4580 – Redundant Probe System – Color
Page 17 of 23
•
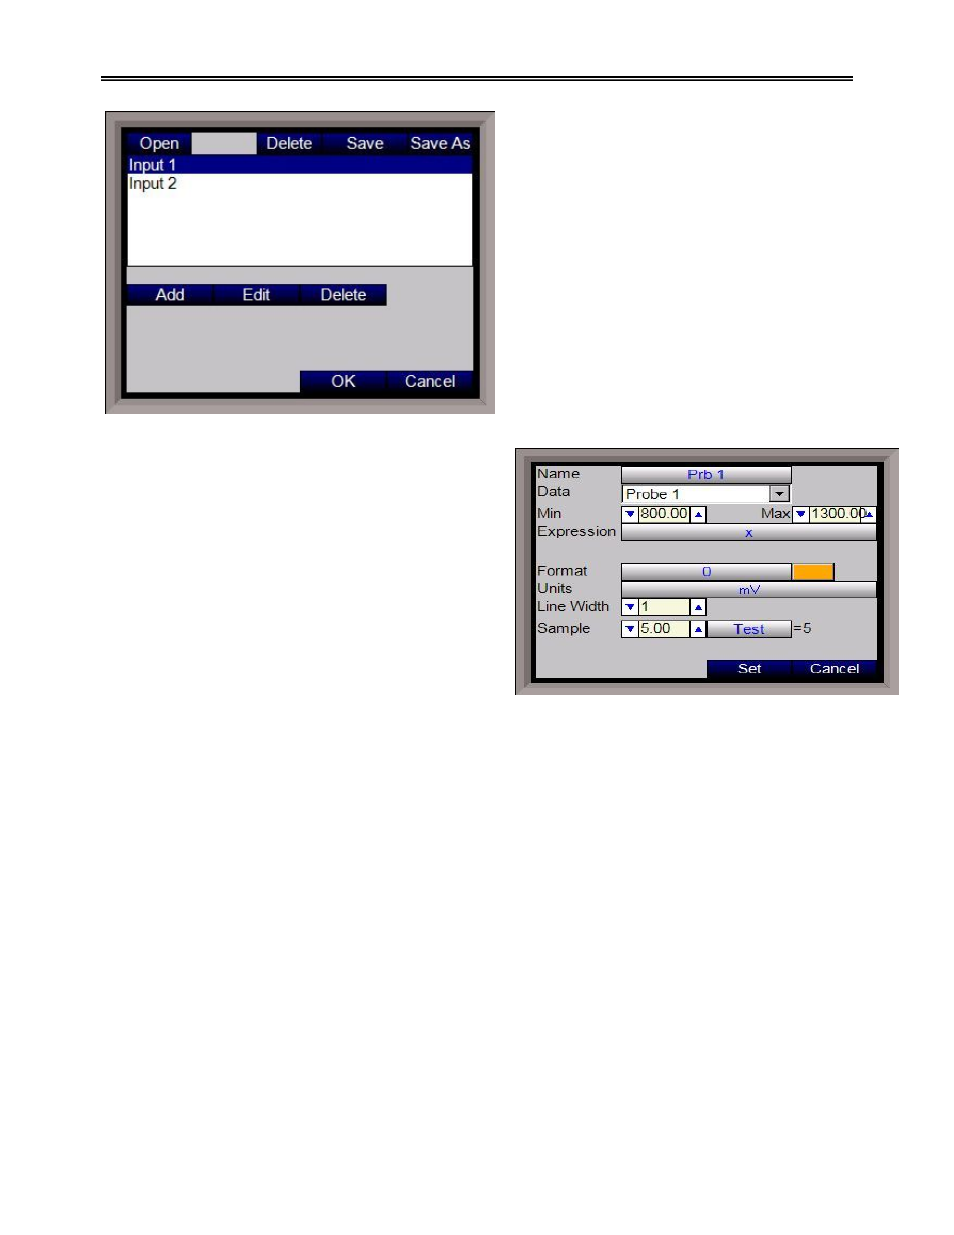
Open – Open an existing trend chart
•
Delete – Delete an existing trend chart
•
Save – Save any changes made to the
current trend chart
•
Save As – Save the current trend chart
as a new trend chart
Open and Delete will display a screen where
the user can select the trend chart to open or
delete. Save will automatically save the
changes to the currently opened trend chart.
Save As will let the user enter the name of the
new trend chart.
The three buttons below the list of trend items
will allow the user to modify individual trend
items:
•
Add – Add a new trend line to the trend
chart
•
Edit – Edit an existing trend line in the trend
chart
•
Delete – Delete an existing trend line in the
trend chart
Add and Edit will display a screen (shown) where the
user can set up the trend line. Delete will delete the
selected trend line from the trend chart.
•
Name – This is the name of the trend line.
Note – since space is limited, it is
suggested that the trend lines be named
with least understood characters, i.e., “Prb
1” instead of “Probe 1”
•
Data – This is the data from the data log data.
Descriptions are used to make the selection of
data easier. If no description is provided, the register number is provided
•
Min – This is the minimum value for the scale of the data
•
Max – This is the maximum value for the scale of the data
•
Expression – The expression to display the data with the correct scaling. Data in the registers
does not have any scale. For instance, T/C data will require the “x*0.1” expression to display the
T/C values properly. Trend lines that do not require any scaling will just need an “x” as the
expression. Probe values do not need scaling
•
Format - the value displayed on the chart display of the operator interface. A short custom
description can be added here. For example, to display one (1) decimal point, enter a value of
“#0.0”. For carbon values, enter a value of “#0.00” for 2 decimals. This would display a value
like “0.81”. Entering “#.00” would display a value of “.81”
•
Units – The type of units to be displayed
•
Line Width - A numeric value for the thickness of the trend line. A 1 is a thin line; A higher value
= thicker line width
•
Sample – This will allow the user to test the expression to verify that the expression is set up
properly. Enter the test value and press the Test button to see if the expression displays the value
properly. For instance, if the “x*0.1” expression is used and “1500” is entered, then the result
would display “150”
Press the Set button to confirm the changes made. Pressing the Cancel button will not set any changes.
Return
This option will return the user to the Menu screen.