2 force curve – Interlink Electronics FSR 400 Series User Manual
Page 6
www.interlinkelectronics.com
4
FSR
®
Integration Guide
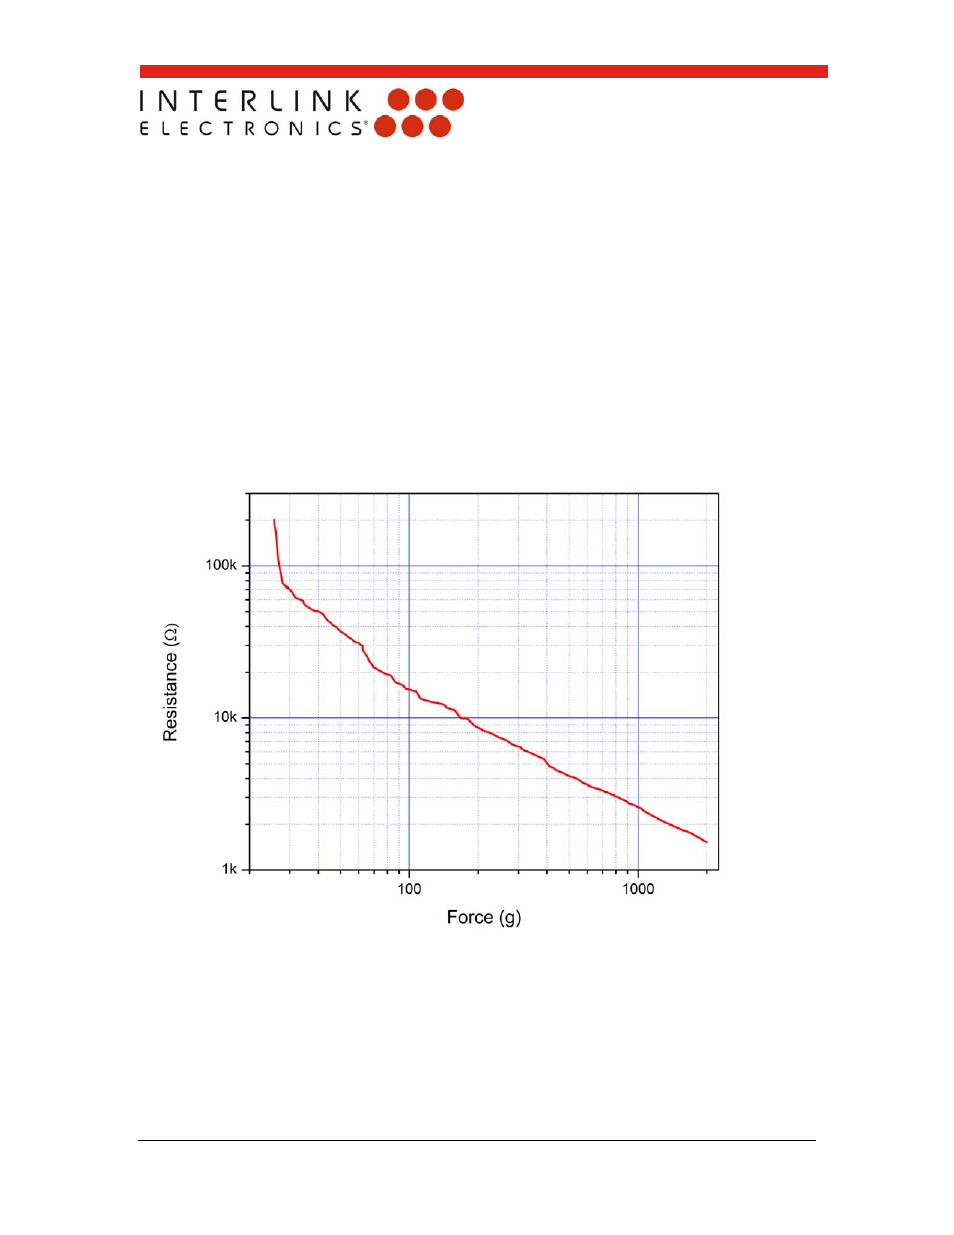
2.2 Force
Curve
A typical resistance vs. force curve is shown in Figure 2. For interpretational
convenience, the data is plotted on logarithmic scales. This particular force-resistance
curve was measured from a model 402 sensor (12.7 mm diameter circular active area). A
silicone rubber actuator with a 4 mm spherical radius tip and 60 Shore A durometer was
used to press on the FSR).
The “actuation force” or turn-on threshold is typically defined as the force required to
bring the sensor from open circuit to below 100kΩ resistance. This force is influenced by
the substrate and overlay thickness and flexibility, size and shape of the actuator, and
spacer-adhesive thickness (the size of the internal air gap between membranes).
Figure 2: Resistance vs. Force
Immediately after turn-on, the resistance decreases very rapidly. At slightly higher and then
intermediate forces, the resistance follows an inverse power law. At the high forces the response
eventually saturates to a point where increases in force yield little or no decrease in resistance.
Saturation can be pushed higher by spreading the applied force over a larger actuator.