Metering display, Understanding the bargraphs and indicators – Omnia Audio Omnia 8x User Manual
Page 26
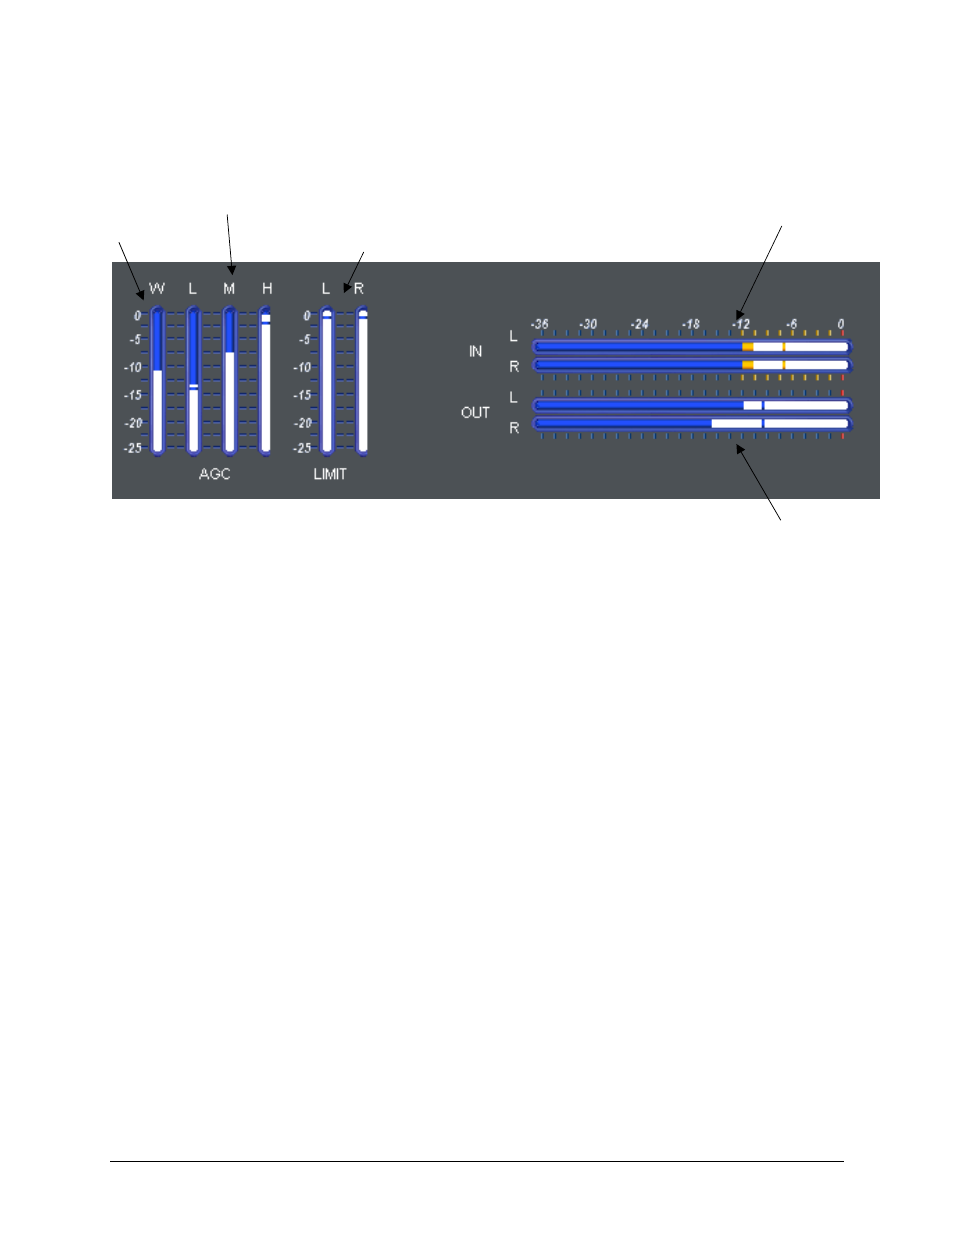
Metering Display
The bargraph meter display is a straightforward representation of what the Omnia 8x is doing:
WB AGC Activity
Multiband Processing Activity
Look-Ahead Limiter Activity
Input Level Meters
Output Level Meters
Omnia 8x is intuitive and easy to use. Applying audio will activate movement on the bargraphs, and this is
confirmation that processing is occurring. Before making adjustments, it helps to know how to interpret the
metering displays.
Understanding the Bargraphs and Indicators
The bargraphs are capable of indicating more than just level information. The texture and density of the audio signal
can be observed, based upon the dynamic action of the bargraphs, and peak-responding indicators. Of interest are
the smaller bars that appear at the end of the solid bargraphs, as they indicate peak level. The solid bar section
represents the RMS average of the signal. Wide dynamic range will display a separation between the peak bars and
the solid bargraph, whereas signal with little peak information will cause the peak bars to ride on the crest of the
bargraph.
The bargraphs provide a wealth of information about the processing control in Omnia 8x. The algorithms
automatically adapt the style of compression/limiting control being employed on a moment-by-moment basis. This
can be deduced if the metering is studied over time. During normal operation, the indicators will have a dynamic
“bounce” that you will be able to get a feel for. Every now and then, you will see the processor react quickly and
show a larger amount of gain reduction. Notice that the response is very fast. This action will recover very slowly,
and return to “rest” with the main bargraph. This action will be easily noticed on material that is very dynamic in
texture.
Another feature unique to Omnia 8x is processor “Hold”. During brief pauses in audio, the bargraphs will “freeze”
and the GATE indicators will show the processor has entered the Hold mode of the algorithm. This is most easily
noticed when there is a “dry” voice being processed. The bargraphs can indicate up to 25 dB of gain reduction.
The Input/Output level meters will change from blue to yellow whenever the level exceeds –12dBfs. Note: The
input and output levels are displayed relative to 0dB full scale (0dBfs). The red “0” indicator on the input/output
bargraphs means that every available bit of signal level is being used at that time! There is nothing more in the level
department, except to create distortion…nasty sounding distortion! For this reason, the input levels should be
reduced if the bargraphs are “in the red” and peaking up to “0” dBfs on a regular basis.
12