Calculated results – Retrotec FanTestic (ATTMA) User Manual
Page 31
rev-2014-10-27
Page 31 of 58
©Retrotec Inc. 2011-2014
4.4.1.4
Correlation, r
This is a measure of how well the data fits the ideal line created from the data readings. This is a
measure of how well the data fits the curve and must be between 98 and 100.
4.4.1.5
Confidence Limit 95%
This shows the 95% confidence limit (lower and upper limits) for each of the results. It means that 19
times out of 20 the results will statistically fall between the lower and upper limit.
4.4.1.6
Intercept (C) and Slope (n)
A Building Leakage Curve (the ideal line) will be created after at least two points have been entered,
which is used to estimate the leakage rate of the building at any pressure.
This curve will be more accurate (line of best fit) after at least three points have been entered. The
Building Leakage Curve is defined by the following equation:
Q = C x P
n
where:
Q is airflow (in CFM)
C is the Air Leakage Coefficient
P is the pressure difference between the inside and outside of the building
n is the slope of the building leakage curve
Example: calculate the airflow needed to create a 5 Pa pressure if:
C = 110.2 n = 0.702
Q, the airflow (at 5 Pa) = 110.2 x 50.702 = 341 CFM.
It would take 341 CFM to cause a 5 Pa pressure change in this building.
4.4.1.7
Intercept, C
env
Data is curve fit to the formula Q
env
= C
env
* P
n
4.4.1.8
Intercept, C
L
Used to calculate the Q
50
using the formula: Q
50
= C
L
* P
n
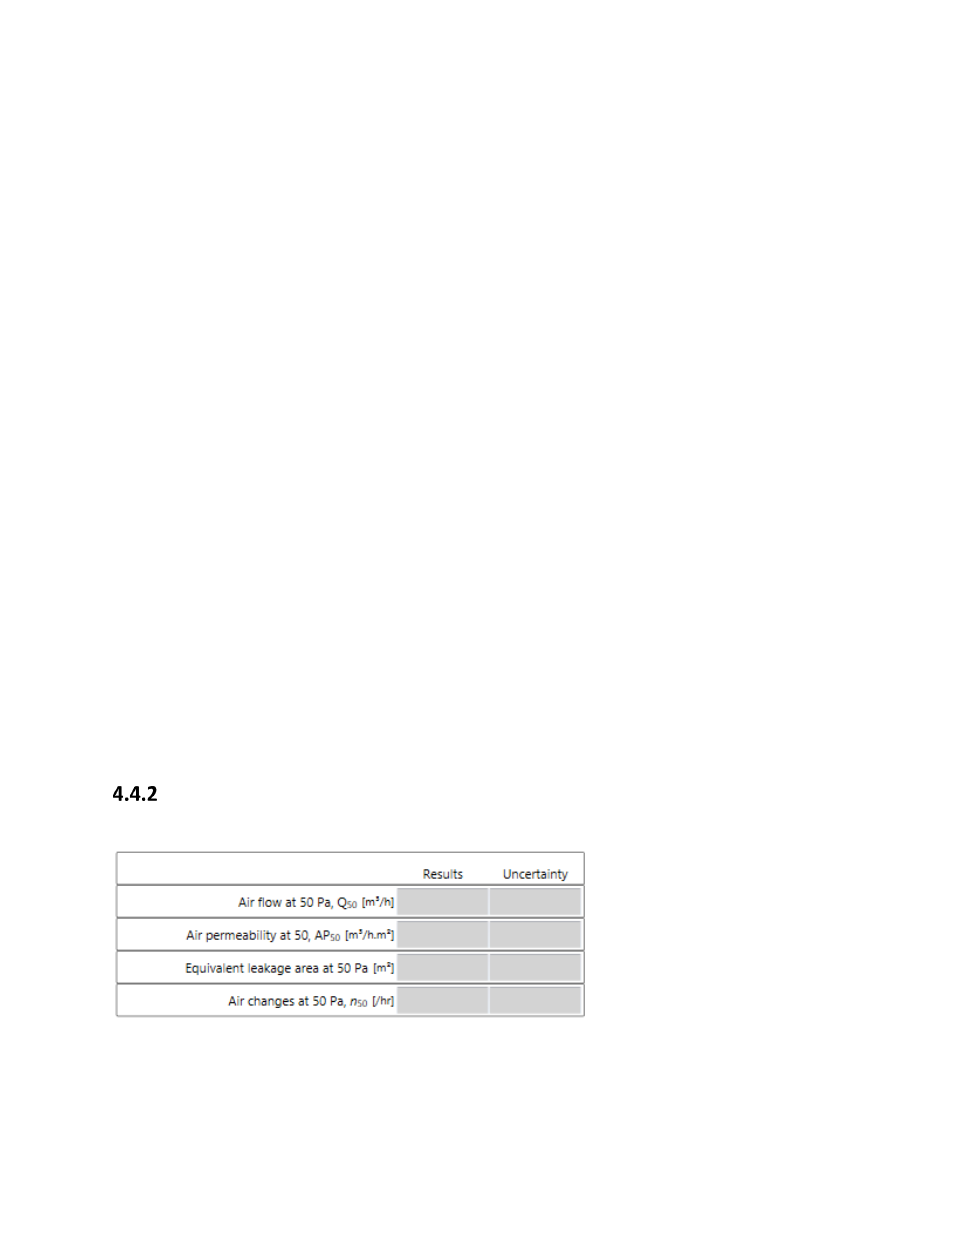
Calculated results
There are a number of results that are available based on the flows recorded in the data set.
4.4.2.1
Air flow at 50 Pa
This value shows the airflow calculated from the curve fit at 50 Pa using the intercept C
L
. This air flow is
used to calculate the other results for this data Set.
This value is sometimes referred to as Q
50
.