Enter test data, 5 enter test data – Retrotec FanTestic (ATTMA) User Manual
Page 33
rev-2014-10-27
Page 33 of 58
©Retrotec Inc. 2011-2014
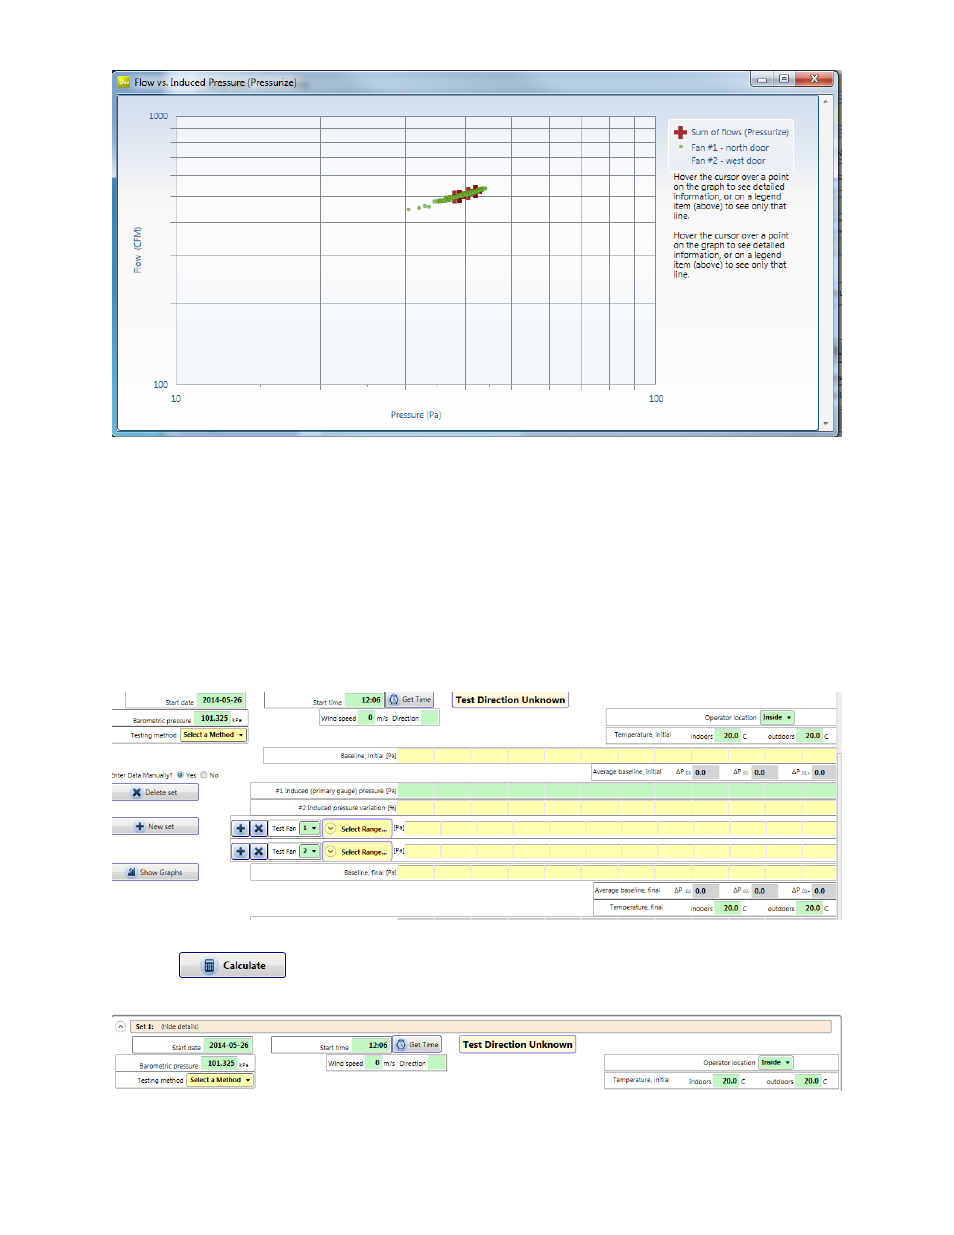
The number and location of the fan from which the readings are taken is shown on the graph legend,
and moving the cursor over the points on the graph shows detail about each reading (pressure and flow
at that point). The individual fan flow readings are shown, as is the sum of all flows in the case of the
use of multiple fans.
If the “Show Graphs” button is clicked after an automatic test starts, the graph will be updated in real
time as the readings are taken.
5 Enter Test Data
The following is an explanation of inputs required for each Data Set :
Manually enter your data into all of the green or yellow boxes. Yellow boxes will turn green after entry.
Click the
button once all the data is entered, where gray boxes are the calculated
results.