FujiFilm X-T20 User Manual
Page 39
Advertising
19
1
Bef
o
re
Y
ou
Beg
in
Camera Displays
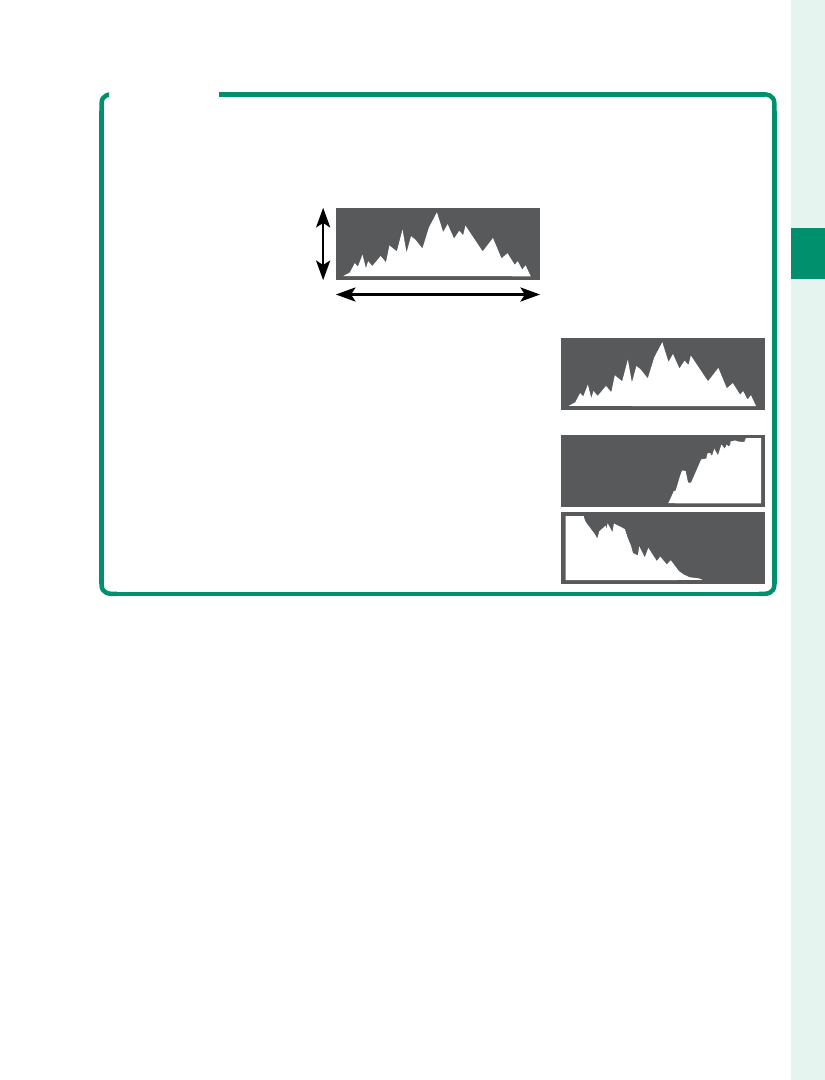
Histograms
Histograms show the distribution of tones in the image.
Brightness is shown by the horizontal axis, the number of pix-
els by the vertical axis.
Number of
pixels
Shadows
Highlights
Pixel brightness
•
Optimal exposure: Pixels are distributed
in an even curve throughout the tone
range.
•
Overexposed: Pixels are clustered on the
right side of the graph.
•
Underexposed: Pixels are clustered on the
left side of the graph.
Advertising