2 calibrating the concentration measurement – K-Patents PR-33-S User Manual
Page 27
5 Configuration and calibration
23
© Copyright K-Patents 2015. All rights reserved.
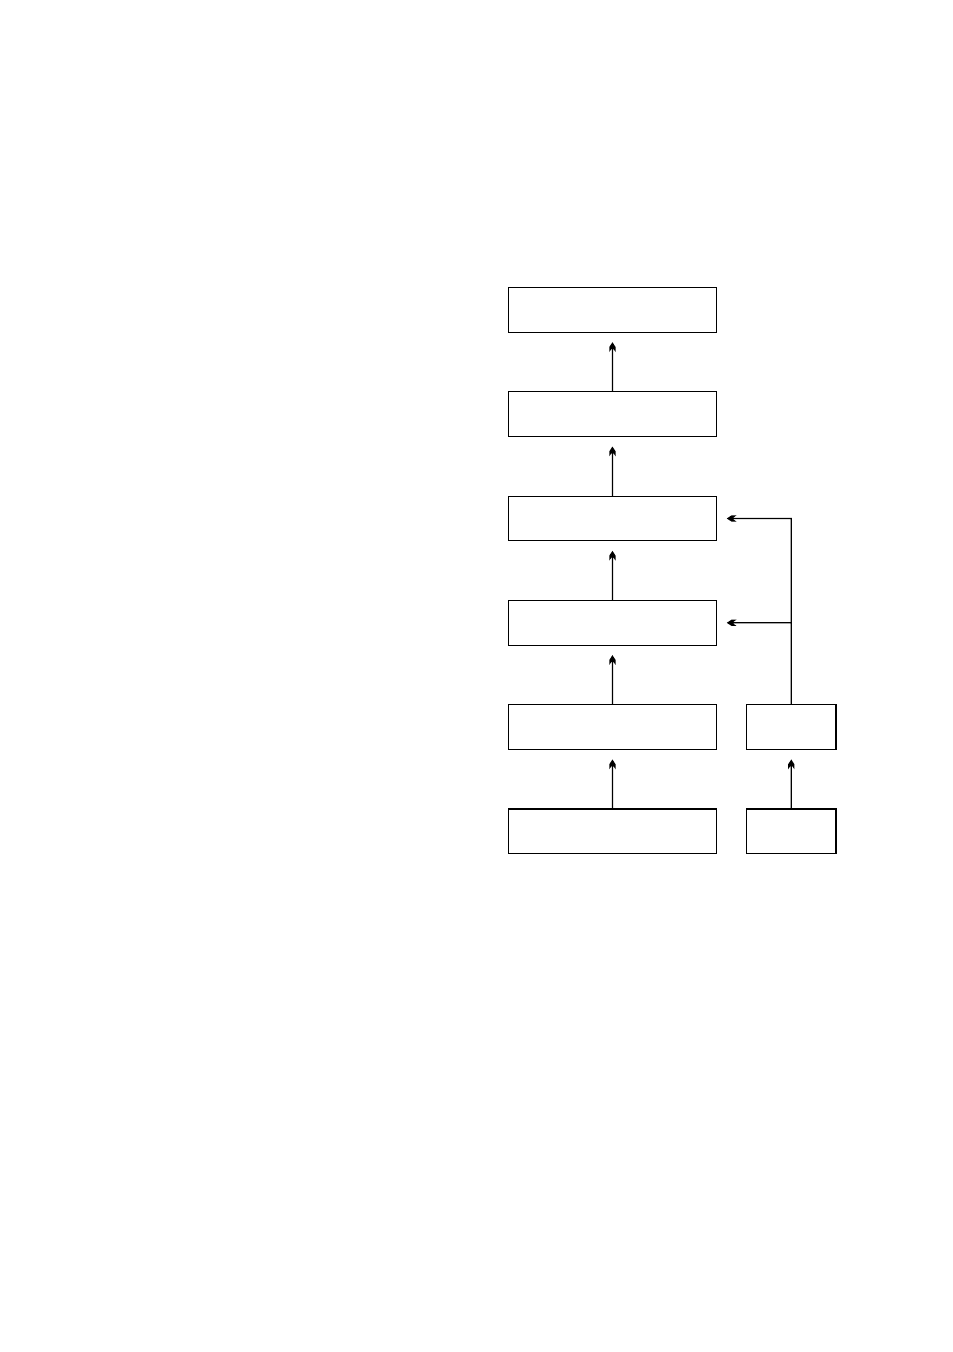
5.2 Calibrating the concentration measurement
ETHERNET
FIELD CALIBRATION
CHEMICAL CURVE
n
D
CCD
TEMP
Pt-1000
CONC
CALC
1.
2.
3.
4.
5.
6.
DAMPING
Figure 5.2
The layers of concentration
calibration
The concentration calibration of the
K-Patents inline refractometer PR-33
is organized in six layers.
1. The information from the CCD
element and the Pt-1000 tem-
perature element. The position
of the shadow edge (Figure 1.4,
“Optical image detection”) is de-
scribed by a number called CCD
and scaled from 0-100 %.
2. The sensor calibration: The ac-
tual refractive index n
D
is calcu-
lated from the CCD value. The
process temperature is calcu-
lated from the Pt-1000 resis-
tance. The sensor output is n
D
and temperature TEMP in Centi-
grade.
Hence, the calibrations
of all PR-33 sensors are identi-
cal, which makes sensors inter-
changeable.
Furthermore, the
calibration of each sensor can be
verified using standard refractive
index liquids.
3. The chemical curve: The sensor calculates the concentration value based on n
D
and
TEMP according to chemical curves derived from available chemical literature and
K-Patents expertise. The result is a temperature compensated calculated concen-
tration value CALC.
4. Field calibration: Adjustment of the calculated concentration value CALC may be
required to compensate for some process conditions or to fit the measurement to
the laboratory results. The Field calibration procedure determines the appropriate