Displaying data and processing a signal, Plot a time waveform, Zoom in on the time waveform – Measurement Computing Medallion Rotate rev.2.3 User Manual
Page 17: Isplaying, Rocessing, Ignal
October 2000
Medallion Rotate Manual
17
D
ISPLAYING
D
ATA
AND
P
ROCESSING
A
S
IGNAL
The second section of the Tutorial leads you through displaying a time
waveform plot. It then describes the steps to process a tachometer signal to get
the instantaneous machine speed in RPM (revolutions per minute).
The Demo_Data.MRD file contains two channels.
• Channel 1 is a time waveform of a pulse tachometer signal varying
between 0 and 4 Volts.
• Channel 2 is a time waveform from a vibration sensor.
P
LOT
A
T
IME
W
AVEFORM
1. Make sure that Channel 1 is the
only selected channel in the
Channel List window. Then
right-click Channel 1 and
choose Plot. You can also do
one of the following:
• Select the channel and click the Plot button
.
• Double-click the channel.
• Select the channel and choose Plot from the Channels menu.
Medallion Rotate displays a plot of the time waveform.
Z
OOM
IN
ON
THE
T
IME
W
AVEFORM
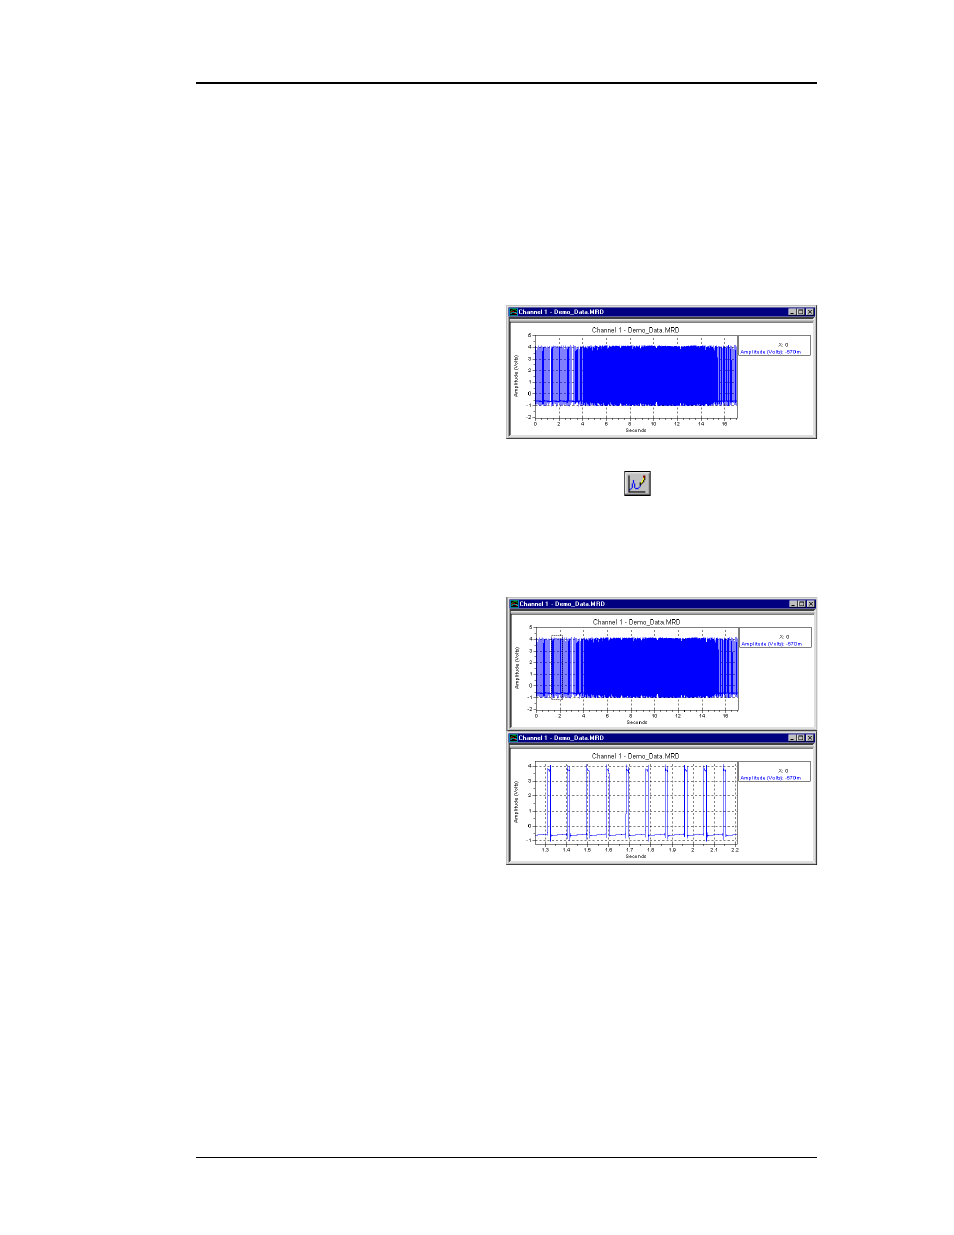
2. Right-click the plot and choose
Zoom.
3. Click and drag the mouse over a
part of the plot to enlarge that
part of the plot.
The plot redraws the zoomed part
when you release the mouse button.
Note the signal amplitude is from -0.5 to
4 Volts.
4. Right-click the plot and choose
Auto-scale to show the whole signal again.